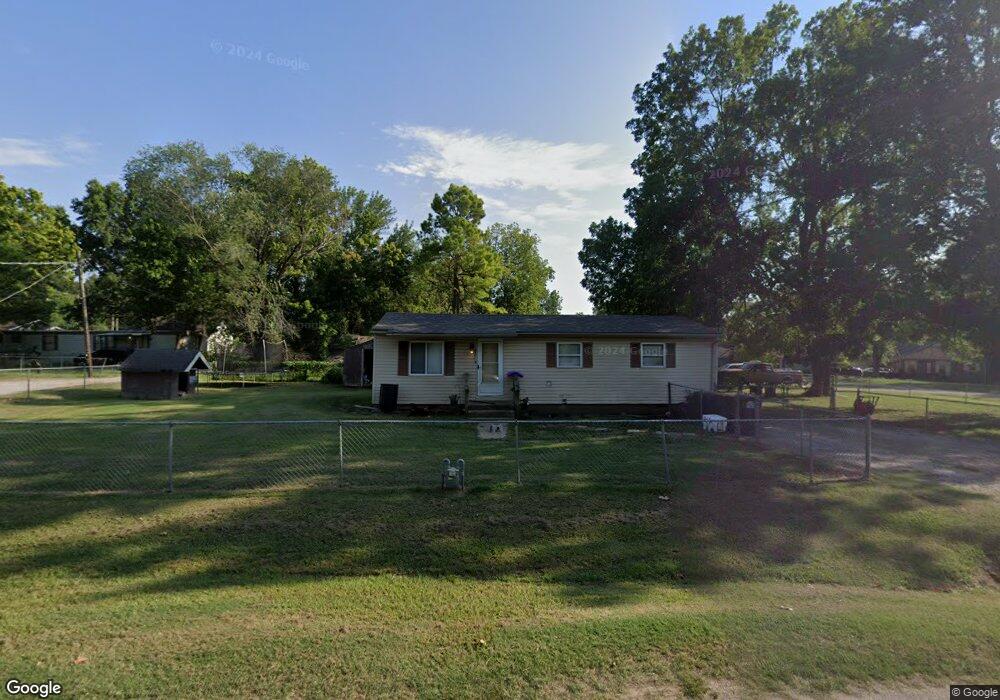
420 W Sycamore St Coweta, OK 74429
Estimated Value: $77,481 - $221,000
--
Bed
1
Bath
800
Sq Ft
$165/Sq Ft
Est. Value
About This Home
This home is located at 420 W Sycamore St, Coweta, OK 74429 and is currently estimated at $132,120, approximately $165 per square foot. 420 W Sycamore St is a home located in Wagoner County with nearby schools including Donald P. Sloat Junior High School, Coweta High School, and Coweta Intermediate High School.
Ownership History
Date
Name
Owned For
Owner Type
Purchase Details
Closed on
Jul 2, 2019
Sold by
Meeks Charles R and Meeks Barbara Jean
Bought by
Parker Holmes Justin Boyd
Current Estimated Value
Purchase Details
Closed on
Mar 26, 2013
Sold by
Steelmon Marci Dalynn and Steelmon Dala J
Bought by
Steelmon Marci Dalynn and Steelmon Dala J
Home Financials for this Owner
Home Financials are based on the most recent Mortgage that was taken out on this home.
Original Mortgage
$26,000
Interest Rate
3.59%
Mortgage Type
Purchase Money Mortgage
Purchase Details
Closed on
Mar 22, 2006
Sold by
Hunter Roy W and Hunter Roy
Bought by
Pool Elizabeth
Home Financials for this Owner
Home Financials are based on the most recent Mortgage that was taken out on this home.
Original Mortgage
$28,000
Interest Rate
6.21%
Mortgage Type
Purchase Money Mortgage
Create a Home Valuation Report for This Property
The Home Valuation Report is an in-depth analysis detailing your home's value as well as a comparison with similar homes in the area
Home Values in the Area
Average Home Value in this Area
Purchase History
| Date | Buyer | Sale Price | Title Company |
|---|---|---|---|
| Parker Holmes Justin Boyd | -- | Wfg National Title | |
| Steelmon Marci Dalynn | -- | None Available | |
| Steelmon Dala J | $22,000 | None Available | |
| Pool Elizabeth | $15,000 | None Available |
Source: Public Records
Mortgage History
| Date | Status | Borrower | Loan Amount |
|---|---|---|---|
| Previous Owner | Steelmon Dala J | $26,000 | |
| Previous Owner | Pool Elizabeth | $28,000 |
Source: Public Records
Tax History Compared to Growth
Tax History
| Year | Tax Paid | Tax Assessment Tax Assessment Total Assessment is a certain percentage of the fair market value that is determined by local assessors to be the total taxable value of land and additions on the property. | Land | Improvement |
|---|---|---|---|---|
| 2025 | $376 | $4,182 | $1,028 | $3,154 |
| 2024 | $376 | $3,983 | $979 | $3,004 |
| 2023 | $358 | $3,793 | $949 | $2,844 |
| 2022 | $339 | $3,613 | $921 | $2,692 |
| 2021 | $329 | $3,441 | $889 | $2,552 |
| 2020 | $305 | $3,277 | $864 | $2,413 |
| 2019 | $296 | $3,121 | $797 | $2,324 |
| 2018 | $287 | $2,973 | $745 | $2,228 |
| 2017 | $269 | $2,831 | $745 | $2,086 |
| 2016 | $257 | $2,697 | $745 | $1,952 |
| 2015 | $255 | $2,568 | $745 | $1,823 |
| 2014 | $241 | $2,446 | $1,344 | $1,102 |
Source: Public Records
Map
Nearby Homes
- 105 S Old Main St
- 226 S Old Main St
- 208 N Division St
- 311 W Ash St
- 317 W Pine St
- 213 W Pine St
- 329 W Oak St
- 504 S Division St
- 500 N Division St
- 512 N Division St
- 508 N Division St
- 420 N Division St
- 616 N Division St
- 11345 S 285th Ave E
- 125 W Walnut St
- 620 S Old Main St
- 0 E 146th St S Unit 2536498
- 514 S Broadway
- 321 S Delaware Ave Unit E
- 222 E Pecan St
- 113 S Old Main St
- 207 S Old Main St
- 408 W Sycamore St
- 419 W Sycamore St
- 117 S Old Main St
- 106 S Division St
- 116 S Division St
- 123 S Old Main St
- 106 S Old Main St
- 100 N Old Main St
- 120 S Old Main St
- 114 S Old Main St
- 122 S Division St
- 117 N Old Main St
- 116 S Old Main St
- 311 W Pecan St
- 105 N Old Main St
- 116 N Division St
- 330 W Sycamore St
- 123 N Old Main St