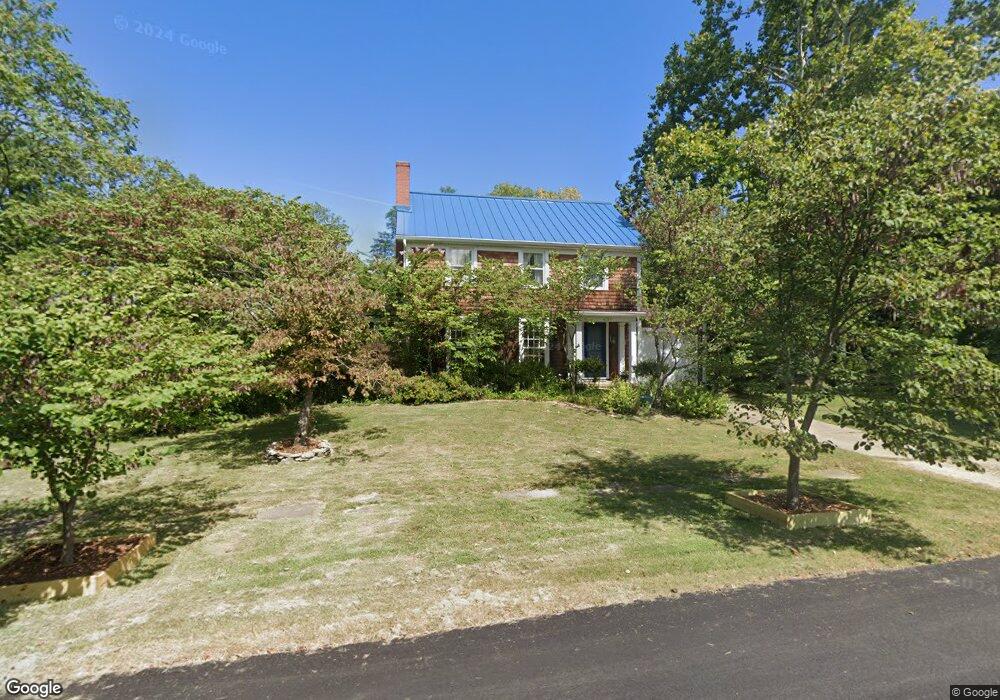
420 W Vine St Oxford, OH 45056
Estimated Value: $228,000 - $320,000
4
Beds
2
Baths
1,872
Sq Ft
$151/Sq Ft
Est. Value
About This Home
This home is located at 420 W Vine St, Oxford, OH 45056 and is currently estimated at $281,828, approximately $150 per square foot. 420 W Vine St is a home located in Butler County with nearby schools including Talawanda Middle School, Talawanda High School, and Mcguffey Montessori School.
Ownership History
Date
Name
Owned For
Owner Type
Purchase Details
Closed on
Jun 21, 2021
Sold by
Currie Brian S
Bought by
Currie Brian S and Currie Kathryn T
Current Estimated Value
Home Financials for this Owner
Home Financials are based on the most recent Mortgage that was taken out on this home.
Original Mortgage
$145,500
Outstanding Balance
$110,472
Interest Rate
2.9%
Mortgage Type
New Conventional
Estimated Equity
$171,356
Purchase Details
Closed on
Jun 10, 2005
Sold by
Henrichsen James P and Henrichsen Sharon M
Bought by
Currie Brian S
Home Financials for this Owner
Home Financials are based on the most recent Mortgage that was taken out on this home.
Original Mortgage
$180,000
Interest Rate
5.74%
Mortgage Type
Purchase Money Mortgage
Purchase Details
Closed on
Jun 23, 2003
Sold by
Deright Dennis A and Deright Karen L
Bought by
Henrichsen James P and Henrichsen Sharon M
Home Financials for this Owner
Home Financials are based on the most recent Mortgage that was taken out on this home.
Original Mortgage
$165,402
Interest Rate
5.71%
Mortgage Type
Purchase Money Mortgage
Purchase Details
Closed on
Nov 22, 2002
Sold by
Deright Dennis A and Deright Karen L
Bought by
Deright Dennis A and Deright Karen L
Create a Home Valuation Report for This Property
The Home Valuation Report is an in-depth analysis detailing your home's value as well as a comparison with similar homes in the area
Home Values in the Area
Average Home Value in this Area
Purchase History
| Date | Buyer | Sale Price | Title Company |
|---|---|---|---|
| Currie Brian S | -- | None Available | |
| Currie Brian S | $200,000 | -- | |
| Henrichsen James P | $180,000 | -- | |
| Deright Dennis A | -- | -- |
Source: Public Records
Mortgage History
| Date | Status | Borrower | Loan Amount |
|---|---|---|---|
| Open | Currie Brian S | $145,500 | |
| Previous Owner | Currie Brian S | $180,000 | |
| Previous Owner | Henrichsen James P | $165,402 |
Source: Public Records
Tax History Compared to Growth
Tax History
| Year | Tax Paid | Tax Assessment Tax Assessment Total Assessment is a certain percentage of the fair market value that is determined by local assessors to be the total taxable value of land and additions on the property. | Land | Improvement |
|---|---|---|---|---|
| 2024 | $3,092 | $83,880 | $22,520 | $61,360 |
| 2023 | $2,967 | $83,880 | $22,520 | $61,360 |
| 2022 | $2,432 | $62,620 | $22,520 | $40,100 |
| 2021 | $2,315 | $62,620 | $22,520 | $40,100 |
| 2020 | $2,421 | $62,620 | $22,520 | $40,100 |
| 2019 | $4,384 | $58,040 | $25,200 | $32,840 |
| 2018 | $2,367 | $58,040 | $25,200 | $32,840 |
| 2017 | $2,127 | $58,040 | $25,200 | $32,840 |
| 2016 | $2,036 | $53,760 | $25,200 | $28,560 |
| 2015 | $2,072 | $53,760 | $25,200 | $28,560 |
| 2014 | $2,016 | $53,760 | $25,200 | $28,560 |
| 2013 | $2,016 | $51,370 | $18,900 | $32,470 |
Source: Public Records
Map
Nearby Homes
- 335 N Locust St
- 48 Indian Cove Cir
- 215 N College Ave
- 327 N College Ave
- 108 W Vine St
- 5999 Contreras Rd
- 115 W Sycamore St
- 435 Lincoln Ave
- 126 Northridge Dr Unit 126
- 136 N Ridge Dr
- 138 N Ridge Dr
- 317 N Beech St
- 6101 Contreras Rd
- 118 Hilltop Rd
- 100 Hilltop Rd
- 843 Dufour Ln
- 5280 Hester Rd
- 6171 Vereker Dr
- 6135 Fairfield Rd
- 5285 College Corner Pike
- 411 W Vine St
- 302 N Locust St
- 409 W Vine St
- 333 N Locust St
- 5020 College Corner Pike Unit C
- 5020 College Corner Pike
- 5020 College Corner Pike C
- 400 W Vine St
- 341 N Locust St
- 330 W Vine St
- 334 N Locust St
- 223 N Locust St
- 336 N Locust St
- 338 N Locust St
- 326 W Vine St
- 340 N Locust St
- 344 N Locust St
- 330 W Withrow St
- 325 W Vine St
- 333 W Sycamore St