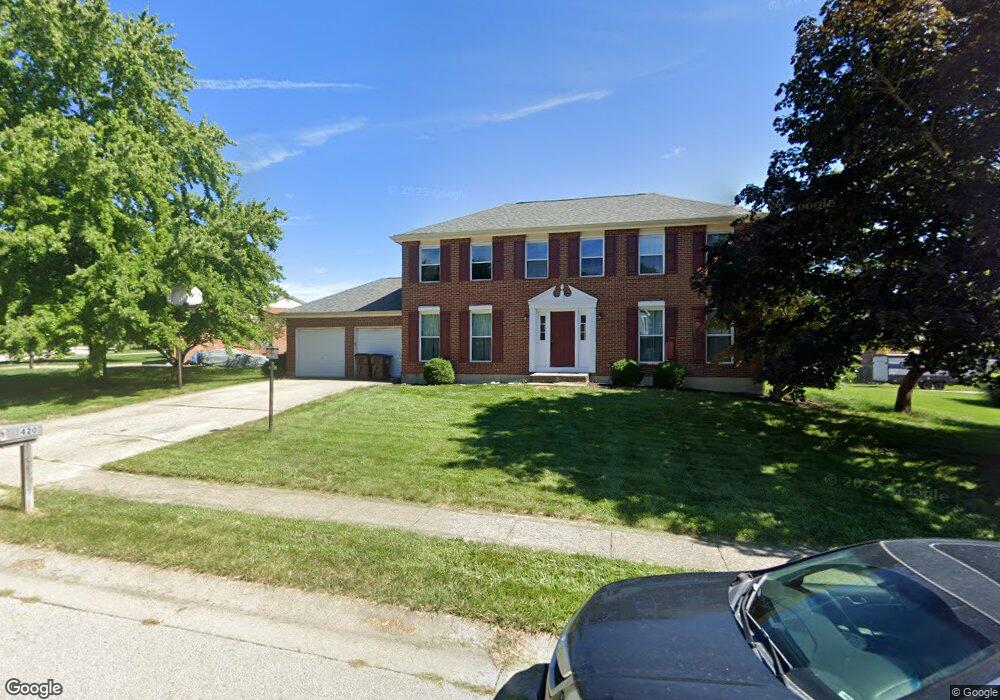
420 Wellington Way Springboro, OH 45066
Estimated Value: $403,000 - $473,000
4
Beds
3
Baths
2,436
Sq Ft
$178/Sq Ft
Est. Value
About This Home
This home is located at 420 Wellington Way, Springboro, OH 45066 and is currently estimated at $434,229, approximately $178 per square foot. 420 Wellington Way is a home located in Warren County with nearby schools including Clearcreek Elementary School, Springboro Intermediate School, and Dennis Elementary School.
Ownership History
Date
Name
Owned For
Owner Type
Purchase Details
Closed on
Oct 2, 2001
Sold by
Porter Michael R
Bought by
Porter Michelle R and Porter Glorida J
Current Estimated Value
Home Financials for this Owner
Home Financials are based on the most recent Mortgage that was taken out on this home.
Original Mortgage
$148,000
Outstanding Balance
$58,271
Interest Rate
6.97%
Mortgage Type
New Conventional
Estimated Equity
$375,958
Purchase Details
Closed on
Aug 11, 1992
Sold by
Fisher George H and Fisher Mary L
Bought by
Henning and Henning James S
Purchase Details
Closed on
Jun 8, 1987
Sold by
Ryan Homes & Inc
Bought by
Fisher and Fisher George H
Purchase Details
Closed on
Feb 17, 1987
Sold by
Tri-Ohio Development Co
Bought by
Ryan Homes & Inc.
Purchase Details
Closed on
May 20, 1986
Sold by
Tri-Ohio Development Co
Bought by
Tri-Ohio Development Co.
Create a Home Valuation Report for This Property
The Home Valuation Report is an in-depth analysis detailing your home's value as well as a comparison with similar homes in the area
Home Values in the Area
Average Home Value in this Area
Purchase History
| Date | Buyer | Sale Price | Title Company |
|---|---|---|---|
| Porter Michelle R | $185,000 | -- | |
| Henning | $165,000 | -- | |
| Fisher | $116,400 | -- | |
| Ryan Homes & Inc. | $21,400 | -- | |
| Tri-Ohio Development Co. | -- | -- |
Source: Public Records
Mortgage History
| Date | Status | Borrower | Loan Amount |
|---|---|---|---|
| Open | Porter Michelle R | $148,000 |
Source: Public Records
Tax History Compared to Growth
Tax History
| Year | Tax Paid | Tax Assessment Tax Assessment Total Assessment is a certain percentage of the fair market value that is determined by local assessors to be the total taxable value of land and additions on the property. | Land | Improvement |
|---|---|---|---|---|
| 2024 | $4,481 | $114,740 | $31,500 | $83,240 |
| 2023 | $3,815 | $89,596 | $16,940 | $72,656 |
| 2022 | $3,759 | $89,597 | $16,940 | $72,657 |
| 2021 | $3,498 | $89,597 | $16,940 | $72,657 |
| 2020 | $3,307 | $74,046 | $14,000 | $60,046 |
| 2019 | $3,049 | $74,046 | $14,000 | $60,046 |
| 2018 | $3,051 | $74,046 | $14,000 | $60,046 |
| 2017 | $2,917 | $63,753 | $12,250 | $51,503 |
| 2016 | $3,042 | $63,753 | $12,250 | $51,503 |
| 2015 | $3,048 | $63,753 | $12,250 | $51,503 |
| 2014 | $3,007 | $59,580 | $11,450 | $48,130 |
| 2013 | $3,005 | $72,860 | $14,000 | $58,860 |
Source: Public Records
Map
Nearby Homes
- 450 Evergreen Dr
- 375 Tamarack Trail
- 510 Royal Springs Dr
- 120 Bramblebush Ln
- 180 Teakwood Ln
- 145 Cedar Hill Ln
- 420 Clearcreek Franklin Rd
- 120 Clearview Dr
- 23 Pheasant Run Cir Unit 9A
- 20 Terradyne Trace
- 150 Tanglewood Dr
- 15 Belvoir Ct
- 510 Thomas Dr
- 1785 Archerfield Place
- 145 Redbud Dr
- 473 Mccray Blvd
- 10987 Ayer Place
- 5561 Sagewood Dr
- The McPherson Plan at Wadestone - Designer Collection
- Winslow Plan at Wadestone - Masterpiece Collection
- 430 Wellington Way
- 339 Saint James Place
- 355 Saint James Place
- 355 St James Place
- 415 Wellington Way
- 440 Wellington Way
- 405 Wellington Way
- 425 Wellington Way
- 435 Wellington Way
- 371 Saint James Place
- 324 Saint James Place
- 375 Wellington Way
- 445 Wellington Way
- 340 Saint James Place
- 284 Tamarack Trail
- 286 Tamarack Trail
- 450 Wellington Way
- 282 Tamarack Trail
- 288 Tamarack Trail
- 365 Wellington Way