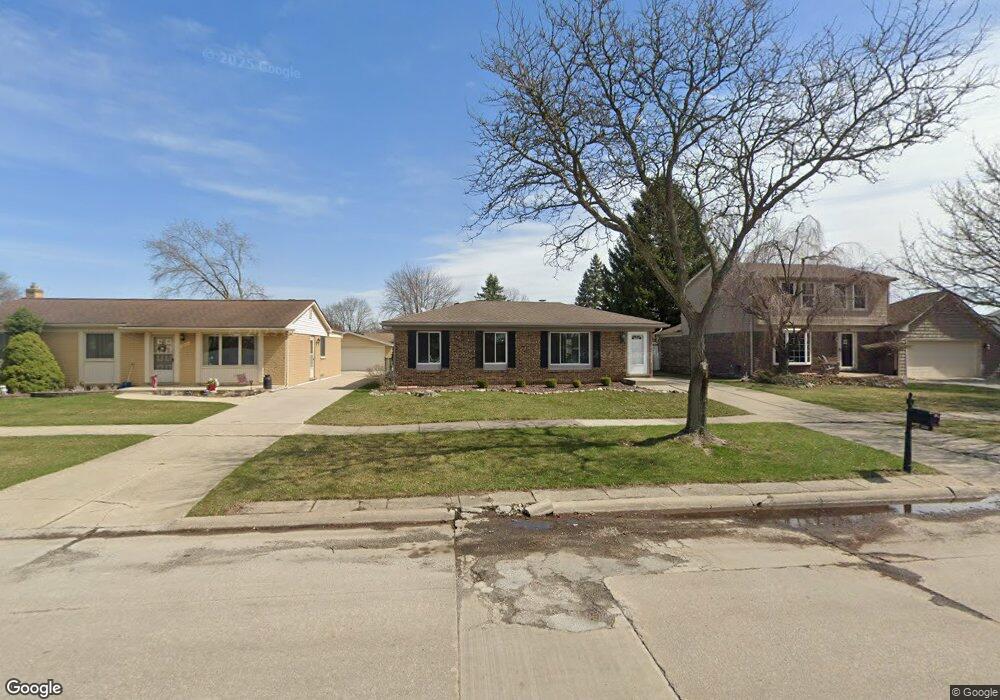
42000 Cimarron St Unit Bldg-Unit Clinton Township, MI 48038
Estimated Value: $243,000 - $286,000
3
Beds
2
Baths
1,164
Sq Ft
$235/Sq Ft
Est. Value
About This Home
This home is located at 42000 Cimarron St Unit Bldg-Unit, Clinton Township, MI 48038 and is currently estimated at $272,960, approximately $234 per square foot. 42000 Cimarron St Unit Bldg-Unit is a home located in Macomb County with nearby schools including Miami Elementary School, Wyandot Middle School, and Chippewa Valley High School.
Ownership History
Date
Name
Owned For
Owner Type
Purchase Details
Closed on
Jan 24, 2023
Sold by
Secretary Of Veterans Affairs
Bought by
Small Robert K
Current Estimated Value
Purchase Details
Closed on
Jul 18, 2022
Sold by
Stanwich Mortgage Loan Trust
Bought by
Secretary Of Veterans Affairs
Purchase Details
Closed on
Jan 14, 2022
Sold by
Macomb County Sheriff
Bought by
Stanwich Mortgage Loan Trust
Purchase Details
Closed on
Sep 21, 2018
Sold by
Sligh Joanne
Bought by
Sligh Joanne and Santangelo James
Purchase Details
Closed on
Mar 21, 2018
Sold by
Krall Laura A
Bought by
Sligh Joanne
Purchase Details
Closed on
Jan 27, 2018
Sold by
Krall Scott A
Bought by
Krall Laura A
Purchase Details
Closed on
Dec 28, 2000
Sold by
Williams David G
Bought by
Krall Scott A
Create a Home Valuation Report for This Property
The Home Valuation Report is an in-depth analysis detailing your home's value as well as a comparison with similar homes in the area
Home Values in the Area
Average Home Value in this Area
Purchase History
| Date | Buyer | Sale Price | Title Company |
|---|---|---|---|
| Small Robert K | $165,000 | -- | |
| Secretary Of Veterans Affairs | -- | Shureb Caleb J | |
| Secretary Of Veterans Affairs | -- | Shureb Caleb J | |
| Stanwich Mortgage Loan Trust | $163,898 | Orlans Pc | |
| Sligh Joanne | -- | None Available | |
| Sligh Joanne | $170,000 | Devon Title Agency | |
| Krall Laura A | -- | None Available | |
| Krall Scott A | $145,000 | -- |
Source: Public Records
Mortgage History
| Date | Status | Borrower | Loan Amount |
|---|---|---|---|
| Closed | Krall Scott A | -- |
Source: Public Records
Tax History Compared to Growth
Tax History
| Year | Tax Paid | Tax Assessment Tax Assessment Total Assessment is a certain percentage of the fair market value that is determined by local assessors to be the total taxable value of land and additions on the property. | Land | Improvement |
|---|---|---|---|---|
| 2025 | $6,355 | $110,500 | $0 | $0 |
| 2024 | $4,556 | $105,700 | $0 | $0 |
| 2023 | $3,470 | $94,600 | $0 | $0 |
| 2022 | $4,905 | $85,900 | $0 | $0 |
| 2021 | $4,845 | $79,100 | $0 | $0 |
| 2020 | $2,194 | $76,200 | $0 | $0 |
| 2019 | $2,930 | $72,000 | $0 | $0 |
| 2018 | $3,753 | $66,000 | $0 | $0 |
| 2017 | $4,251 | $61,800 | $15,500 | $46,300 |
| 2016 | $3,474 | $61,800 | $0 | $0 |
| 2015 | -- | $57,500 | $0 | $0 |
| 2014 | -- | $52,300 | $0 | $0 |
| 2011 | -- | $50,300 | $17,100 | $33,200 |
Source: Public Records
Map
Nearby Homes
- 41786 Fonthill Ct
- 41759 Fonthill Ct
- 41591 Westmeath Cir
- 42113 Clayton St
- 42011 Clayton St
- 41571 Westmeath Cir
- 16296 Picton Ct
- 16136 Conifer Ln
- 42418 Bayberry Unit 76
- 16104 Conifer Ln
- 16341 Scenic Unit 73
- 41912 King Edward Ct Unit 39
- 42504 Arbor Dr
- 42664 Arbor Dr
- 42728 Arbor Dr
- 42632 Arbor Dr
- Abbeyville Plan at Maple Ridge
- Bayport Plan at Maple Ridge
- 41381 Clayton St
- 41225 Greenspire Dr
- 42000 Cimarron St
- 41966 Cimarron St
- 42014 Cimarron St
- 41954 Cimarron St
- 41955 Hensall St
- 41967 Hensall St
- 16018 Touraine Dr
- 41943 Hensall St
- 16006 Touraine Dr
- 41979 Hensall St
- 41942 Cimarron St
- 15887 Sigwalt Dr
- 41931 Hensall St
- 41931 Hensall St
- 15888 Sigwalt Dr
- 41999 Hensall St
- 41930 Cimarron St
- 41919 Hensall St
- 15873 Sigwalt Dr
- 15886 Touraine Ct