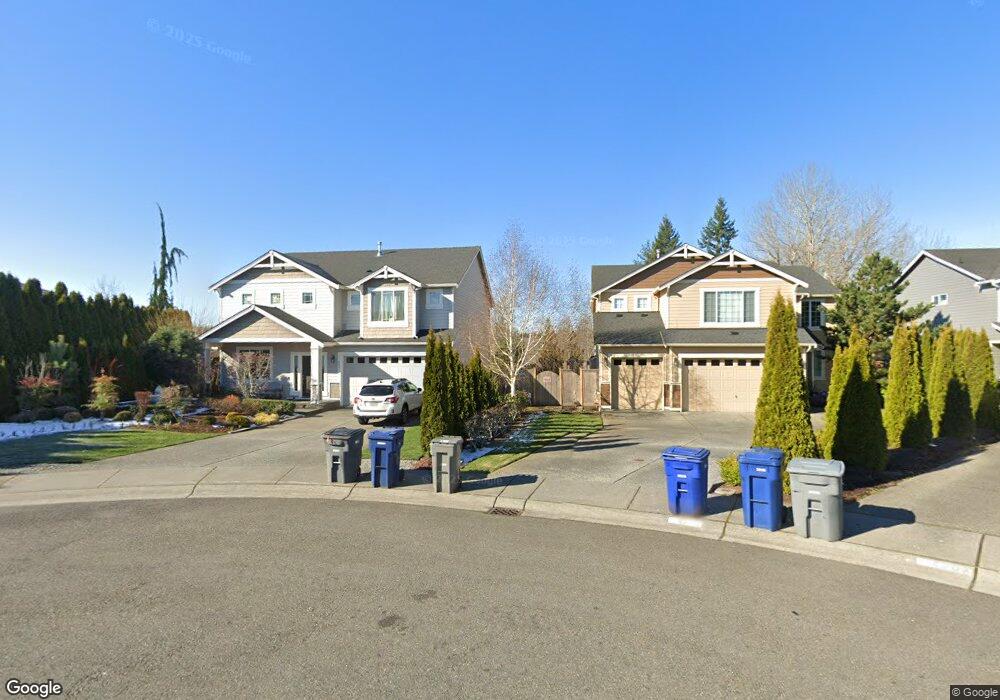
4201 143rd Place SE Snohomish, WA 98296
Estimated Value: $1,115,646 - $1,206,000
4
Beds
3
Baths
2,607
Sq Ft
$445/Sq Ft
Est. Value
About This Home
This home is located at 4201 143rd Place SE, Snohomish, WA 98296 and is currently estimated at $1,161,162, approximately $445 per square foot. 4201 143rd Place SE is a home located in Snohomish County with nearby schools including Silver Firs Elementary School, Gateway Middle School, and Henry M. Jackson High School.
Ownership History
Date
Name
Owned For
Owner Type
Purchase Details
Closed on
Jun 18, 2011
Sold by
Jayawardane Janaka and Jayawardane Niroshana D
Bought by
Jayawardane Janaka and Jayawardane Niroshana D
Current Estimated Value
Purchase Details
Closed on
Jun 10, 2010
Sold by
Jayawardena Darshini
Bought by
Jayawardena Harsha U
Home Financials for this Owner
Home Financials are based on the most recent Mortgage that was taken out on this home.
Original Mortgage
$419,302
Outstanding Balance
$256,326
Interest Rate
3.25%
Mortgage Type
FHA
Estimated Equity
$904,836
Purchase Details
Closed on
Jun 7, 2010
Sold by
Nw Builders Group Llc
Bought by
Jayawardane Janaka and Jayawardane Niroshana Dilrukshi
Home Financials for this Owner
Home Financials are based on the most recent Mortgage that was taken out on this home.
Original Mortgage
$419,302
Outstanding Balance
$256,326
Interest Rate
3.25%
Mortgage Type
FHA
Estimated Equity
$904,836
Create a Home Valuation Report for This Property
The Home Valuation Report is an in-depth analysis detailing your home's value as well as a comparison with similar homes in the area
Home Values in the Area
Average Home Value in this Area
Purchase History
| Date | Buyer | Sale Price | Title Company |
|---|---|---|---|
| Jayawardane Janaka | $2,808 | None Available | |
| Jayawardena Harsha U | $56,179 | Chicago Title Insurance Co | |
| Jayawardane Janaka | $424,950 | Chicago Title Insurance Co |
Source: Public Records
Mortgage History
| Date | Status | Borrower | Loan Amount |
|---|---|---|---|
| Open | Jayawardane Janaka | $419,302 |
Source: Public Records
Tax History Compared to Growth
Tax History
| Year | Tax Paid | Tax Assessment Tax Assessment Total Assessment is a certain percentage of the fair market value that is determined by local assessors to be the total taxable value of land and additions on the property. | Land | Improvement |
|---|---|---|---|---|
| 2025 | $7,838 | $913,600 | $510,000 | $403,600 |
| 2024 | $7,838 | $863,600 | $474,000 | $389,600 |
| 2023 | $8,451 | $993,100 | $545,000 | $448,100 |
| 2022 | $6,899 | $708,400 | $328,000 | $380,400 |
| 2020 | $7,157 | $590,700 | $280,000 | $310,700 |
| 2019 | $6,378 | $526,500 | $235,000 | $291,500 |
| 2018 | $6,471 | $492,400 | $215,000 | $277,400 |
| 2017 | $5,794 | $440,900 | $180,000 | $260,900 |
| 2016 | $5,469 | $437,700 | $160,000 | $277,700 |
| 2015 | $5,562 | $423,400 | $150,000 | $273,400 |
| 2013 | $5,091 | $343,000 | $130,000 | $213,000 |
Source: Public Records
Map
Nearby Homes
- 14220 41st Dr SE
- 14117 45th Ave SE
- 4012 147th Place SE
- 4620 145th Place SE
- 4418 137th Place SE
- 13708 45th Dr SE
- 14915 38th Dr SE Unit JJ1180
- 14915 38th Dr SE Unit U1153
- 14915 38th Dr SE Unit H3031
- 14915 38th Dr SE Unit S1146
- 14632 35th Dr SE
- 4716 138th St SE
- 4720 138th St SE
- 4826 140th St SE
- 4708 138th St SE
- 13811 48th Dr SE Unit A
- 15111 38th Dr SE
- 13815 48th Dr SE
- 4305 136th St SE
- 14912 48th Ave SE
- 4205 143rd Place SE
- 4133 144th St SE
- 4207 143rd Place SE
- 4207 143rd Place SE Unit L2
- 4127 144th St SE
- 4209 143rd Place SE
- 4207 144th St SE
- 4215 143rd Place SE
- 146 42nd Dr SE Unit Lot 2
- 146 42nd Dr SE Unit L14
- 146 42nd Dr SE Unit Lot14
- 4217 143rd Place SE
- 4203 143rd St SE
- 4219 144th St SE
- 4206 143rd St SE
- 4211 143rd St SE
- 14233 41st Dr SE
- 4221 143rd Place SE
- 4214 143rd St SE
- 14231 41st Dr SE