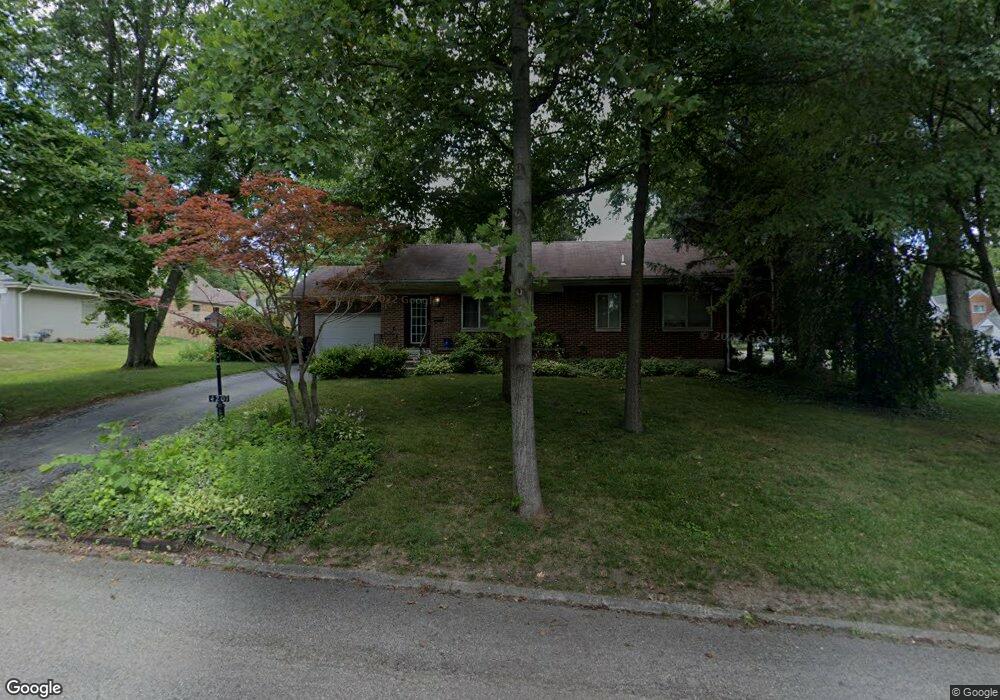
4201 Breckenridge Rd Dayton, OH 45429
Estimated Value: $218,000 - $237,000
2
Beds
1
Bath
1,284
Sq Ft
$178/Sq Ft
Est. Value
About This Home
This home is located at 4201 Breckenridge Rd, Dayton, OH 45429 and is currently estimated at $228,476, approximately $177 per square foot. 4201 Breckenridge Rd is a home located in Montgomery County with nearby schools including Southdale Elementary School, Van Buren Middle School, and Kettering Fairmont High School.
Ownership History
Date
Name
Owned For
Owner Type
Purchase Details
Closed on
Nov 24, 2020
Sold by
Lucente Janet L
Bought by
Topp Tyler James and Topp Sara
Current Estimated Value
Home Financials for this Owner
Home Financials are based on the most recent Mortgage that was taken out on this home.
Original Mortgage
$102,000
Outstanding Balance
$91,133
Interest Rate
2.9%
Mortgage Type
New Conventional
Estimated Equity
$137,343
Purchase Details
Closed on
Dec 3, 2002
Sold by
Lindemuth John E and Lindemuth Julia I
Bought by
Lucente Janet L
Home Financials for this Owner
Home Financials are based on the most recent Mortgage that was taken out on this home.
Original Mortgage
$96,000
Interest Rate
6.38%
Mortgage Type
Balloon
Purchase Details
Closed on
Mar 10, 1998
Sold by
Lucente Julia I
Bought by
Lindemuth John E and Lucente Julia I
Home Financials for this Owner
Home Financials are based on the most recent Mortgage that was taken out on this home.
Original Mortgage
$76,300
Interest Rate
7.14%
Create a Home Valuation Report for This Property
The Home Valuation Report is an in-depth analysis detailing your home's value as well as a comparison with similar homes in the area
Home Values in the Area
Average Home Value in this Area
Purchase History
| Date | Buyer | Sale Price | Title Company |
|---|---|---|---|
| Topp Tyler James | $120,000 | Wave Title Agency Inc | |
| Lucente Janet L | $120,000 | -- | |
| Lindemuth John E | -- | Dayton Title Agency Inc | |
| Lindemuth John E | -- | -- |
Source: Public Records
Mortgage History
| Date | Status | Borrower | Loan Amount |
|---|---|---|---|
| Open | Topp Tyler James | $102,000 | |
| Closed | Lucente Janet L | $96,000 | |
| Previous Owner | Lindemuth John E | $76,300 |
Source: Public Records
Tax History Compared to Growth
Tax History
| Year | Tax Paid | Tax Assessment Tax Assessment Total Assessment is a certain percentage of the fair market value that is determined by local assessors to be the total taxable value of land and additions on the property. | Land | Improvement |
|---|---|---|---|---|
| 2024 | $3,795 | $59,890 | $17,090 | $42,800 |
| 2023 | $3,795 | $59,890 | $17,090 | $42,800 |
| 2022 | $3,586 | $44,760 | $12,750 | $32,010 |
| 2021 | $3,322 | $44,760 | $12,750 | $32,010 |
| 2020 | $3,259 | $44,760 | $12,750 | $32,010 |
| 2019 | $2,784 | $33,780 | $12,130 | $21,650 |
| 2018 | $2,799 | $33,780 | $12,130 | $21,650 |
| 2017 | $2,578 | $33,780 | $12,130 | $21,650 |
| 2016 | $2,768 | $34,090 | $12,130 | $21,960 |
| 2015 | $2,644 | $34,090 | $12,130 | $21,960 |
| 2014 | $2,644 | $34,090 | $12,130 | $21,960 |
| 2012 | -- | $37,460 | $12,190 | $25,270 |
Source: Public Records
Map
Nearby Homes
- 298 Marchester Dr
- 4259 Maxlin Rd
- 604 Schuyler Dr
- 115 N Bromfield Rd
- 305 Glenridge Rd
- 791 Willowdale Ave
- 804 Lovetta Dr
- 4808 Judith Dr
- 4816 Judith Dr
- 4824 Far Hills Ave
- 645 Brookfield Rd
- 3993 Applewood Ln
- 3822 Milford Dr
- 617 Laurelann Dr
- 4241 Schrubb Dr
- 101 Enid Ave
- 501 Judith Dr
- 5016 Far Hills Ave
- 959 Kimberly Dr
- 4951 Walnut Walk
- 108 Napoleon Dr
- 0 Breckenridge Trail Unit 618484
- 111 Castle Dr
- 26 Napoleon Dr
- 116 Napoleon Dr
- 4125 Breckenridge Rd
- 109 Napoleon Dr
- 27 Castle Dr
- 119 Castle Dr
- 117 Napoleon Dr
- 4124 Breckenridge Rd
- 20 Napoleon Dr
- 132 Napoleon Dr
- 127 Castle Dr
- 21 Castle Dr
- 4101 Breckenridge Rd
- 125 Napoleon Dr
- 108 Sherbrooke Dr
- 112 Castle Dr
- 4233 Breckenridge Rd