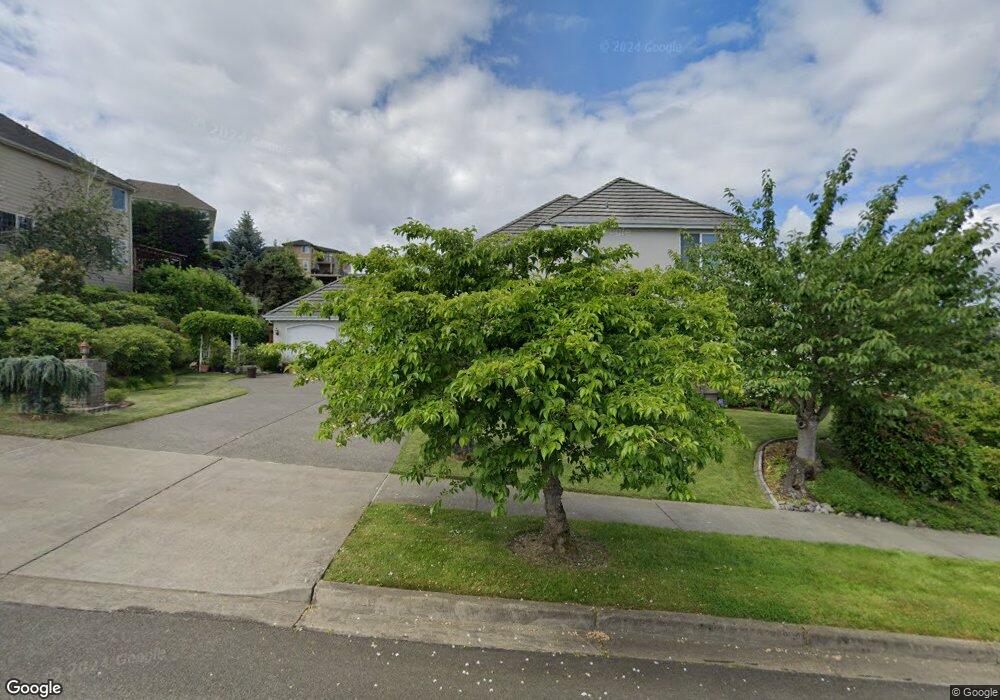
4201 Crystal Lane Loop SE Puyallup, WA 98372
Estimated Value: $789,153 - $965,000
3
Beds
3
Baths
2,690
Sq Ft
$320/Sq Ft
Est. Value
About This Home
This home is located at 4201 Crystal Lane Loop SE, Puyallup, WA 98372 and is currently estimated at $861,038, approximately $320 per square foot. 4201 Crystal Lane Loop SE is a home located in Pierce County with nearby schools including Shaw Road Elementary School, Kalles Junior High School, and Puyallup High School.
Ownership History
Date
Name
Owned For
Owner Type
Purchase Details
Closed on
Apr 10, 2019
Sold by
Le Anh Kim
Bought by
Le To Nga
Current Estimated Value
Purchase Details
Closed on
Jan 18, 2011
Sold by
Bennion Dean Slade and Bennion Lesli
Bought by
Le Anh Lim and Le To Nga
Home Financials for this Owner
Home Financials are based on the most recent Mortgage that was taken out on this home.
Original Mortgage
$180,000
Outstanding Balance
$116,516
Interest Rate
3.75%
Mortgage Type
New Conventional
Estimated Equity
$744,522
Purchase Details
Closed on
Jul 13, 2010
Sold by
Caliguri Richard F
Bought by
Bennion Dean Slade and Eastside Funding Llc
Home Financials for this Owner
Home Financials are based on the most recent Mortgage that was taken out on this home.
Original Mortgage
$119,758
Interest Rate
4.76%
Mortgage Type
Seller Take Back
Purchase Details
Closed on
Jul 9, 2010
Sold by
Eastside Funding Llc
Bought by
Bennion Dean Slade
Home Financials for this Owner
Home Financials are based on the most recent Mortgage that was taken out on this home.
Original Mortgage
$119,758
Interest Rate
4.76%
Mortgage Type
Seller Take Back
Purchase Details
Closed on
Jul 15, 2005
Sold by
Caliguri Kari J
Bought by
Caliguri Richard F
Home Financials for this Owner
Home Financials are based on the most recent Mortgage that was taken out on this home.
Original Mortgage
$90,400
Interest Rate
5.56%
Mortgage Type
Stand Alone Second
Purchase Details
Closed on
Jul 13, 2005
Sold by
Melchior Robert C
Bought by
Caliguri Richard F
Home Financials for this Owner
Home Financials are based on the most recent Mortgage that was taken out on this home.
Original Mortgage
$90,400
Interest Rate
5.56%
Mortgage Type
Stand Alone Second
Purchase Details
Closed on
Apr 1, 2003
Sold by
Glidden William A
Bought by
Melchior Robert C and Melchior Cheryl J
Home Financials for this Owner
Home Financials are based on the most recent Mortgage that was taken out on this home.
Original Mortgage
$279,960
Interest Rate
5.6%
Purchase Details
Closed on
Oct 20, 1998
Sold by
Glidden William A
Bought by
Glidden William A and Glidden Shirley A
Purchase Details
Closed on
Jul 27, 1994
Sold by
Lanway General Contractor Inc
Bought by
Glidden William A and Glidden Shirley A
Home Financials for this Owner
Home Financials are based on the most recent Mortgage that was taken out on this home.
Original Mortgage
$189,000
Interest Rate
8.38%
Create a Home Valuation Report for This Property
The Home Valuation Report is an in-depth analysis detailing your home's value as well as a comparison with similar homes in the area
Home Values in the Area
Average Home Value in this Area
Purchase History
| Date | Buyer | Sale Price | Title Company |
|---|---|---|---|
| Le To Nga | -- | None Available | |
| Le Anh Lim | $360,000 | Fatco | |
| Bennion Dean Slade | $289,001 | None Available | |
| Bennion Dean Slade | -- | None Available | |
| Caliguri Richard F | -- | Fidelity National Title | |
| Caliguri Richard F | $450,000 | Fidelity National Title Ins | |
| Melchior Robert C | $349,950 | Commonwealth Title Co | |
| Glidden William A | -- | -- | |
| Glidden William A | -- | Chicago Title |
Source: Public Records
Mortgage History
| Date | Status | Borrower | Loan Amount |
|---|---|---|---|
| Open | Le Anh Lim | $180,000 | |
| Previous Owner | Bennion Dean Slade | $119,758 | |
| Previous Owner | Caliguri Richard F | $90,400 | |
| Previous Owner | Caliguri Richard F | $359,600 | |
| Previous Owner | Melchior Robert C | $279,960 | |
| Previous Owner | Glidden William A | $189,000 | |
| Closed | Melchior Robert C | $52,492 |
Source: Public Records
Tax History Compared to Growth
Tax History
| Year | Tax Paid | Tax Assessment Tax Assessment Total Assessment is a certain percentage of the fair market value that is determined by local assessors to be the total taxable value of land and additions on the property. | Land | Improvement |
|---|---|---|---|---|
| 2025 | $6,978 | $776,700 | $253,000 | $523,700 |
| 2024 | $6,978 | $773,000 | $245,700 | $527,300 |
| 2023 | $6,978 | $717,700 | $238,500 | $479,200 |
| 2022 | $6,608 | $702,700 | $234,200 | $468,500 |
| 2021 | $6,686 | $563,500 | $199,500 | $364,000 |
| 2019 | $6,505 | $568,900 | $176,300 | $392,600 |
| 2018 | $6,703 | $544,800 | $157,700 | $387,100 |
| 2017 | $6,391 | $496,900 | $135,400 | $361,500 |
| 2016 | $5,582 | $404,200 | $109,500 | $294,700 |
| 2014 | $4,559 | $376,900 | $81,200 | $295,700 |
| 2013 | $4,559 | $336,900 | $71,100 | $265,800 |
Source: Public Records
Map
Nearby Homes
- 1811 Crystal Lane Loop SE
- 1811 39th St SE
- 8705 143rd Avenue Ct E Unit 48
- 8608 143rd Avenue Ct E Unit 14
- 1415 39th St SE
- 8314 144th Ave E
- 3114 Highlands Blvd
- 8401 State Route 162 E
- 1903 Shaw Rd
- 8011 148th Avenue Ct E
- 7608 145th Avenue Ct E Unit 30
- 7526 145th Ave E Unit 41
- 0 XXXX Shaw Rd & E Pioneer
- 3216 31st Ave SE
- 2822 29th Street Ct SE
- 15708 81st St E Unit 131
- 2405 Terrace Dr
- 14717 73rd St E
- 0 25th St SE
- 2921 Forest Rim Ct S
- 4040 Crystal Ridge Dr SE
- 4209 Crystal Lane Loop SE
- 0 L23 Crystal Lane Loop SE
- 0 XXXX Crystal Lane Loop SE
- 3902 39th (Lot 1) St SE
- 4202 Crystal Lane Loop SE
- 4041 Crystal Ridge Dr SE
- 4032 Crystal Ridge Dr SE
- 4217 Crystal Lane Loop SE
- 4033 Crystal Ridge Dr SE
- 1605 41st Street Place SE
- 4101 Crystal Ridge Dr SE
- 4119 Crystal Lane Loop SE
- 4108 Crystal Lane Loop SE
- 4218 Crystal Lane Loop SE
- 4026 Crystal Ridge Dr SE
- 4106 Crystal Ridge Dr SE
- 1601 41st Street Place SE
- 4029 Crystal Ridge Dr SE
- 4227 Crystal Lane Loop SE