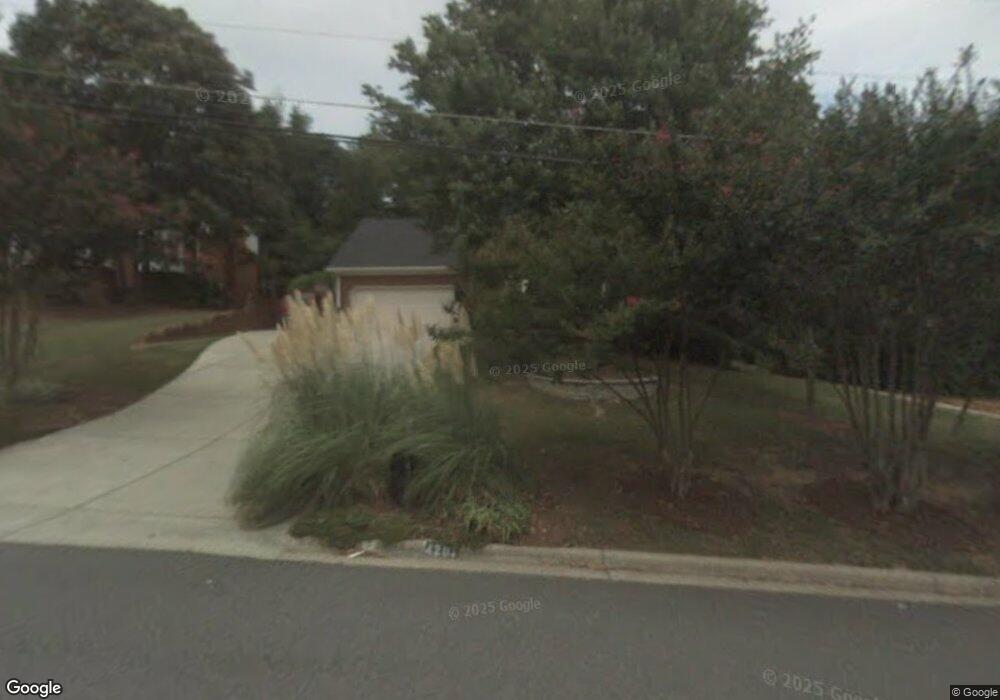
4201 Flippen Trail Unit 9 Norcross, GA 30092
Estimated Value: $731,000 - $843,000
4
Beds
3
Baths
3,233
Sq Ft
$244/Sq Ft
Est. Value
About This Home
This home is located at 4201 Flippen Trail Unit 9, Norcross, GA 30092 and is currently estimated at $789,499, approximately $244 per square foot. 4201 Flippen Trail Unit 9 is a home located in Gwinnett County with nearby schools including Simpson Elementary School, Pinckneyville Middle School, and Norcross High School.
Ownership History
Date
Name
Owned For
Owner Type
Purchase Details
Closed on
Jan 5, 2018
Sold by
Pinkston Karyn Lynn
Bought by
Gibbons Martin J and Pinkston Karyn Lynn
Current Estimated Value
Home Financials for this Owner
Home Financials are based on the most recent Mortgage that was taken out on this home.
Original Mortgage
$297,000
Outstanding Balance
$163,699
Interest Rate
3.94%
Mortgage Type
New Conventional
Estimated Equity
$625,800
Purchase Details
Closed on
Dec 21, 2017
Sold by
Pinkston Scott D
Bought by
Pinkston Karyn Lynn
Home Financials for this Owner
Home Financials are based on the most recent Mortgage that was taken out on this home.
Original Mortgage
$297,000
Outstanding Balance
$163,699
Interest Rate
3.94%
Mortgage Type
New Conventional
Estimated Equity
$625,800
Purchase Details
Closed on
May 15, 1996
Sold by
Betts Malcolm C Elvie C
Bought by
Pinkston Scott D Karyn Lynn
Create a Home Valuation Report for This Property
The Home Valuation Report is an in-depth analysis detailing your home's value as well as a comparison with similar homes in the area
Home Values in the Area
Average Home Value in this Area
Purchase History
| Date | Buyer | Sale Price | Title Company |
|---|---|---|---|
| Gibbons Martin J | -- | -- | |
| Pinkston Karyn Lynn | -- | -- | |
| Pinkston Scott D Karyn Lynn | $213,000 | -- |
Source: Public Records
Mortgage History
| Date | Status | Borrower | Loan Amount |
|---|---|---|---|
| Open | Pinkston Karyn Lynn | $297,000 | |
| Closed | Pinkston Scott D Karyn Lynn | $0 |
Source: Public Records
Tax History Compared to Growth
Tax History
| Year | Tax Paid | Tax Assessment Tax Assessment Total Assessment is a certain percentage of the fair market value that is determined by local assessors to be the total taxable value of land and additions on the property. | Land | Improvement |
|---|---|---|---|---|
| 2025 | $7,872 | $312,560 | $53,080 | $259,480 |
| 2024 | $7,189 | $270,960 | $52,960 | $218,000 |
| 2023 | $7,189 | $285,280 | $46,560 | $238,720 |
| 2022 | $6,876 | $255,080 | $38,200 | $216,880 |
| 2021 | $7,734 | $206,280 | $37,360 | $168,920 |
| 2020 | $7,780 | $206,280 | $37,360 | $168,920 |
| 2019 | $6,827 | $187,160 | $32,960 | $154,200 |
| 2018 | $6,849 | $187,160 | $32,960 | $154,200 |
| 2016 | $5,098 | $164,120 | $26,200 | $137,920 |
| 2015 | $5,127 | $164,120 | $26,200 | $137,920 |
| 2014 | -- | $155,800 | $26,200 | $129,600 |
Source: Public Records
Map
Nearby Homes
- 5885 Match Point
- 5440 Clinchfield Trail
- 5649 Whitesburg Ct
- 3962 Gunnin Rd
- 5961 Ranger Ct
- 4053 Spalding Hollow NW
- 5786 Broxton Cir
- 5545 Fitzpatrick Terrace
- 5970 Rachel Ridge Unit 2
- 5221 W Jones Bridge Rd
- 5350 Wickershire Dr
- 5863 Revington Dr
- 6169 Poplar Bluff Cir
- 4102 Ailey Ct
- 5397 Valley Mist Ct
- 3922 Glen Meadow Dr
- 6040 Neely Farm Dr Unit 3
- 4211 Flippen Trail
- 4191 Flippen Trail
- 4221 Flippen Trail
- 4181 Flippen Trail
- 4200 Flippen Trail
- 4190 Flippen Trail
- 4210 Flippen Trail
- 4210 Flippen Trail Unit 9
- 4231 Flippen Trail Unit 9
- 4220 Flippen Trail
- 4180 Flippen Trail Unit 9
- 4171 Flippen Trail
- 5707 Bellville Way Unit 9
- 5697 Bellville Way
- 4241 Flippen Trail
- 4170 Flippen Trail
- 4230 Flippen Trail
- 5717 Bellville Way
- 4161 Flippen Trail Unit 9
- 5687 Bellville Way