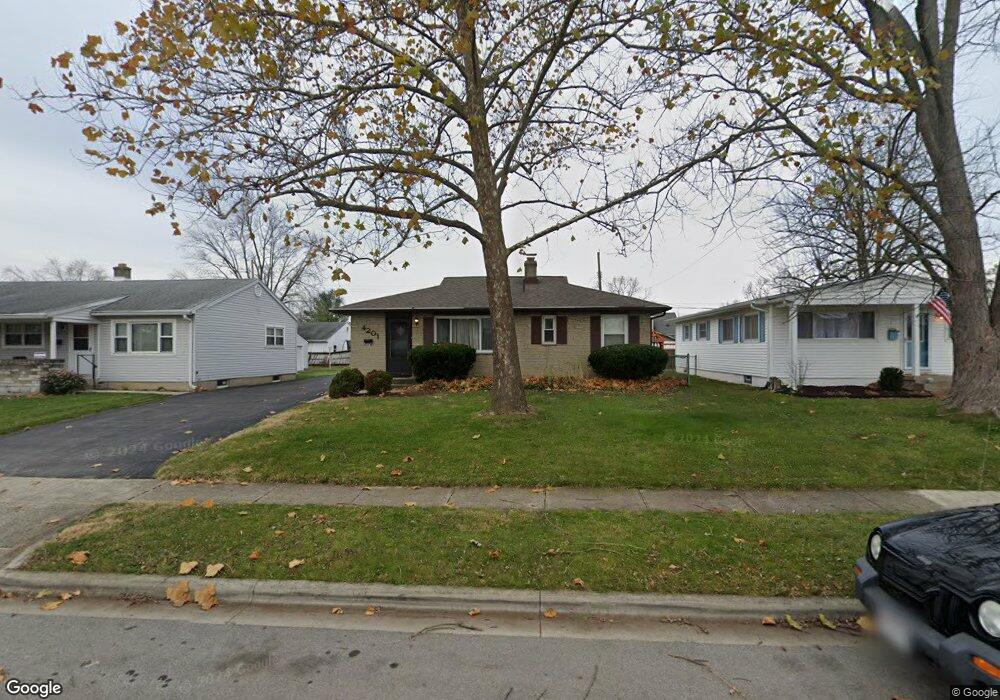
4201 Maplegrove Dr Grove City, OH 43123
Estimated Value: $237,000 - $250,000
3
Beds
1
Bath
972
Sq Ft
$251/Sq Ft
Est. Value
About This Home
This home is located at 4201 Maplegrove Dr, Grove City, OH 43123 and is currently estimated at $243,742, approximately $250 per square foot. 4201 Maplegrove Dr is a home located in Franklin County with nearby schools including Jc Sommer Elementary School, Park Street Intermediate School, and Jackson Middle School.
Ownership History
Date
Name
Owned For
Owner Type
Purchase Details
Closed on
Apr 3, 2008
Sold by
Marx Cathy Diane and Cordle Cathy D
Bought by
Marx Paul Timothy and Marx Cathy Diane
Current Estimated Value
Purchase Details
Closed on
Mar 8, 2001
Sold by
Mcneal Donald E and Mcneal Kathy A
Bought by
Cordle Cathy D
Home Financials for this Owner
Home Financials are based on the most recent Mortgage that was taken out on this home.
Original Mortgage
$50,000
Outstanding Balance
$18,424
Interest Rate
7.18%
Estimated Equity
$225,318
Purchase Details
Closed on
Oct 10, 1997
Sold by
Godsoe Jean A
Bought by
Mcneal Donald E and Mcneal Kathy A
Home Financials for this Owner
Home Financials are based on the most recent Mortgage that was taken out on this home.
Original Mortgage
$82,650
Interest Rate
7.65%
Purchase Details
Closed on
Oct 29, 1993
Purchase Details
Closed on
Jun 20, 1989
Create a Home Valuation Report for This Property
The Home Valuation Report is an in-depth analysis detailing your home's value as well as a comparison with similar homes in the area
Home Values in the Area
Average Home Value in this Area
Purchase History
| Date | Buyer | Sale Price | Title Company |
|---|---|---|---|
| Marx Paul Timothy | -- | Attorney | |
| Cordle Cathy D | $95,000 | Chicago Title | |
| Mcneal Donald E | $87,300 | Chicago Title | |
| -- | $73,000 | -- | |
| -- | $68,000 | -- |
Source: Public Records
Mortgage History
| Date | Status | Borrower | Loan Amount |
|---|---|---|---|
| Open | Cordle Cathy D | $50,000 | |
| Previous Owner | Mcneal Donald E | $82,650 |
Source: Public Records
Tax History Compared to Growth
Tax History
| Year | Tax Paid | Tax Assessment Tax Assessment Total Assessment is a certain percentage of the fair market value that is determined by local assessors to be the total taxable value of land and additions on the property. | Land | Improvement |
|---|---|---|---|---|
| 2024 | $3,456 | $75,990 | $18,310 | $57,680 |
| 2023 | $3,407 | $75,985 | $18,305 | $57,680 |
| 2022 | $2,297 | $37,670 | $8,160 | $29,510 |
| 2021 | $2,342 | $37,670 | $8,160 | $29,510 |
| 2020 | $2,334 | $37,670 | $8,160 | $29,510 |
| 2019 | $2,018 | $30,210 | $6,790 | $23,420 |
| 2018 | $2,293 | $30,210 | $6,790 | $23,420 |
| 2017 | $2,003 | $30,210 | $6,790 | $23,420 |
| 2016 | $2,575 | $35,530 | $7,880 | $27,650 |
| 2015 | $2,576 | $35,530 | $7,880 | $27,650 |
| 2014 | $2,578 | $35,530 | $7,880 | $27,650 |
| 2013 | $1,217 | $35,525 | $7,875 | $27,650 |
Source: Public Records
Map
Nearby Homes
- 4236 Maplegrove Dr
- 4277 Beechgrove Dr
- 4318 Maplegrove Dr
- 2746 Queensway Dr
- 2690 Eugene Ave
- 4287 Knapp Dr
- 3084 Sawyer Dr
- 3910 Security Dr
- 4256 Eleanor Ave
- 3944 Girbert St
- 4521 Haughn Rd
- 3163 Gunderman Ave
- 2403 White Rd
- 3687 Homecomer Dr
- 3933 Glenna Ave
- 3815 Queen Anne Place Unit B19
- 3826 Queen Anne Place Unit B7
- 3830 Queen Anne Place Unit A9
- 3828 Queen Anne Place Unit B8
- 3660 Brinkman Dr
- 4193 Maplegrove Dr
- 4185 Maplegrove Dr
- 4215 Maplegrove Dr
- 4202 Brookgrove Dr
- 4194 Brookgrove Dr
- 4210 Brookgrove Dr
- 4179 Maplegrove Dr
- 4221 Maplegrove Dr
- 4188 Brookgrove Dr
- 4218 Brookgrove Dr
- 4200 Maplegrove Dr
- 4192 Maplegrove Dr
- 4208 Maplegrove Dr
- 4186 Maplegrove Dr
- 4182 Brookgrove Dr
- 4216 Maplegrove Dr
- 4224 Brookgrove Dr
- 4173 Maplegrove Dr
- 4180 Maplegrove Dr
- 4222 Maplegrove Dr