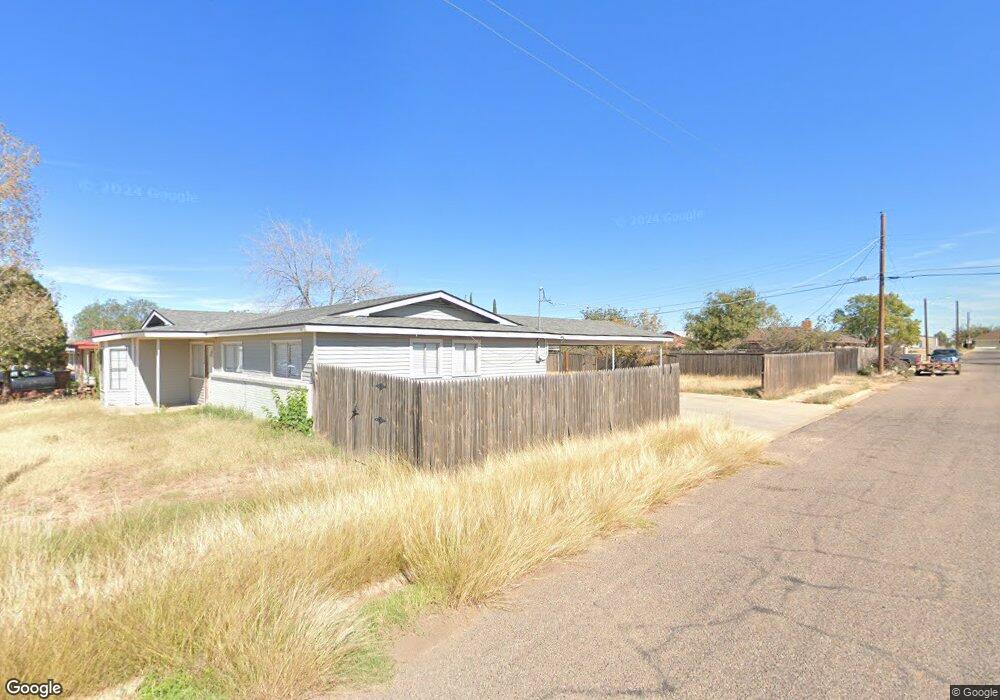
4201 Muir St Big Spring, TX 79720
Estimated Value: $170,632 - $207,000
Studio
--
Bath
1,834
Sq Ft
$100/Sq Ft
Est. Value
About This Home
This home is located at 4201 Muir St, Big Spring, TX 79720 and is currently estimated at $184,158, approximately $100 per square foot. 4201 Muir St is a home located in Howard County with nearby schools including Big Spring High School, St. Mary's Episcopal School, and Nazarene Christian Academy Big Spring.
Ownership History
Date
Name
Owned For
Owner Type
Purchase Details
Closed on
Mar 5, 2021
Sold by
Rosenbaum Chuck
Bought by
Gomez Jorge
Current Estimated Value
Home Financials for this Owner
Home Financials are based on the most recent Mortgage that was taken out on this home.
Original Mortgage
$153,174
Outstanding Balance
$136,056
Interest Rate
2.7%
Mortgage Type
FHA
Estimated Equity
$48,102
Purchase Details
Closed on
Mar 17, 2014
Sold by
Cdr Investments Inc
Bought by
Rosenbaum Chuck
Purchase Details
Closed on
Nov 15, 2011
Sold by
Secretary Of Housing And Urban Developme
Bought by
Cdr Investments Inc
Purchase Details
Closed on
Sep 13, 2010
Sold by
Wells Fargo Bank Na
Bought by
The Secretary Of Hsng & Urban Developmen
Purchase Details
Closed on
Sep 7, 2010
Sold by
Demeny Ronald B and Demeny Yuri
Bought by
Wells Fargo Bank Na
Create a Home Valuation Report for This Property
The Home Valuation Report is an in-depth analysis detailing your home's value as well as a comparison with similar homes in the area
Purchase History
| Date | Buyer | Sale Price | Title Company |
|---|---|---|---|
| Gomez Jorge | -- | Surety Title Company | |
| Rosenbaum Chuck | -- | Surety Title Company | |
| Cdr Investments Inc | -- | None Available | |
| The Secretary Of Hsng & Urban Developmen | -- | None Available | |
| Wells Fargo Bank Na | $35,318 | None Available |
Source: Public Records
Mortgage History
| Date | Status | Borrower | Loan Amount |
|---|---|---|---|
| Open | Gomez Jorge | $153,174 |
Source: Public Records
Tax History
| Year | Tax Paid | Tax Assessment Tax Assessment Total Assessment is a certain percentage of the fair market value that is determined by local assessors to be the total taxable value of land and additions on the property. | Land | Improvement |
|---|---|---|---|---|
| 2025 | $1,555 | $162,315 | $10,159 | $152,156 |
| 2024 | $2,626 | $147,556 | $9,697 | $137,859 |
| 2023 | $2,770 | $157,169 | $10,350 | $146,819 |
| 2022 | $3,732 | $182,819 | $9,000 | $173,819 |
| 2021 | $3,141 | $133,645 | $9,000 | $124,645 |
| 2020 | $2,489 | $104,706 | $9,000 | $95,706 |
| 2019 | $2,390 | $94,478 | $9,000 | $85,478 |
| 2018 | $2,809 | $93,760 | $7,200 | $86,560 |
| 2017 | $1,746 | $59,312 | $7,200 | $52,112 |
| 2016 | $1,776 | $60,335 | $7,200 | $53,135 |
| 2015 | -- | $65,020 | $7,200 | $57,820 |
| 2014 | -- | $53,852 | $5,400 | $48,452 |
Source: Public Records
Map
Nearby Homes
- 4032 Vicky St
- 3901 Dixon St
- 2101 Grace St
- 1902 Winston St
- 3614 Hamilton St
- 2202 Carl St
- 2108 Cecilia St
- 4608 Wasson Rd
- 4610 Wasson Rd
- 1902 Wasson Rd
- 2511 Cheyenne Dr
- 2511 Alamesa Dr
- 311 Lawrence Rd
- 14 Village Rd
- 2902 Cactus Dr
- 3700 Boulder Dr
- 0 Wasson Rd
- 2805 Navajo Dr
- 2802 Navajo Dr
- 2801 Crestline Rd
Your Personal Tour Guide
Ask me questions while you tour the home.