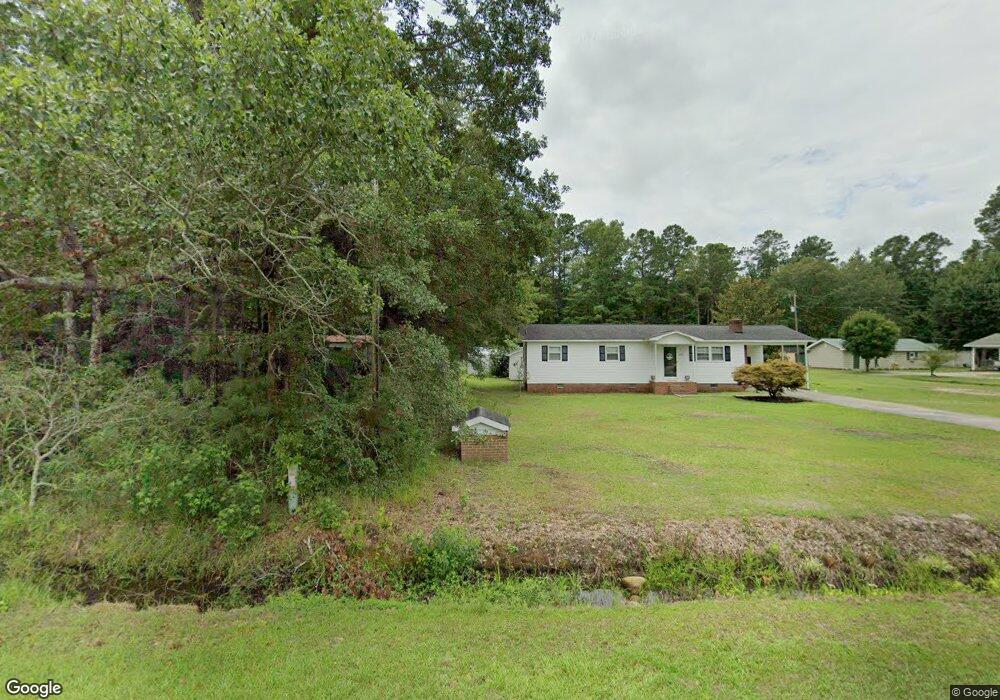
4202 Armfield Rd Effingham, SC 29541
Estimated Value: $129,696 - $158,000
3
Beds
2
Baths
1,170
Sq Ft
$125/Sq Ft
Est. Value
About This Home
This home is located at 4202 Armfield Rd, Effingham, SC 29541 and is currently estimated at $145,674, approximately $124 per square foot. 4202 Armfield Rd is a home located in Florence County with nearby schools including Dewey-Carter Elementary School, Southside Middle School, and South Florence High School.
Ownership History
Date
Name
Owned For
Owner Type
Purchase Details
Closed on
Sep 12, 2025
Sold by
Whitaker Brooke Nicole and Palmer Jacyn O
Bought by
Palmer Jacyn O
Current Estimated Value
Home Financials for this Owner
Home Financials are based on the most recent Mortgage that was taken out on this home.
Original Mortgage
$109,000
Outstanding Balance
$109,000
Interest Rate
6.58%
Mortgage Type
New Conventional
Estimated Equity
$36,674
Purchase Details
Closed on
Mar 18, 2022
Sold by
Wanda Carlson
Bought by
Whitaker Brooke Nicole and Palmer Jacyn O
Purchase Details
Closed on
Mar 16, 2022
Sold by
Nettles Howard J
Bought by
Carlson Wanda
Purchase Details
Closed on
Dec 8, 2020
Sold by
Nettles Howard J and Nettles Chad O
Bought by
Whitaker Brooke Nicole and Palmer Jacyn O
Home Financials for this Owner
Home Financials are based on the most recent Mortgage that was taken out on this home.
Original Mortgage
$77,595
Interest Rate
2.8%
Mortgage Type
New Conventional
Purchase Details
Closed on
Oct 14, 2020
Sold by
James Nettles Homer
Bought by
Nettles Howard J and Nettles Chad O
Home Financials for this Owner
Home Financials are based on the most recent Mortgage that was taken out on this home.
Original Mortgage
$77,595
Interest Rate
2.8%
Mortgage Type
New Conventional
Create a Home Valuation Report for This Property
The Home Valuation Report is an in-depth analysis detailing your home's value as well as a comparison with similar homes in the area
Home Values in the Area
Average Home Value in this Area
Purchase History
| Date | Buyer | Sale Price | Title Company |
|---|---|---|---|
| Palmer Jacyn O | $20,000 | Vantage Point Title | |
| Palmer Jacyn O | $20,000 | Vantage Point Title | |
| Whitaker Brooke Nicole | -- | Howle Law Firm | |
| Carlson Wanda | -- | Howle Law Firm | |
| Whitaker Brooke Nicole | $79,995 | None Available | |
| Nettles Howard J | -- | Howle Law Firm |
Source: Public Records
Mortgage History
| Date | Status | Borrower | Loan Amount |
|---|---|---|---|
| Open | Palmer Jacyn O | $109,000 | |
| Closed | Palmer Jacyn O | $109,000 | |
| Previous Owner | Whitaker Brooke Nicole | $77,595 |
Source: Public Records
Tax History Compared to Growth
Tax History
| Year | Tax Paid | Tax Assessment Tax Assessment Total Assessment is a certain percentage of the fair market value that is determined by local assessors to be the total taxable value of land and additions on the property. | Land | Improvement |
|---|---|---|---|---|
| 2024 | $394 | $4,566 | $396 | $4,170 |
| 2023 | $342 | $3,274 | $396 | $2,878 |
| 2022 | $1,800 | $3,274 | $396 | $2,878 |
| 2021 | $1,737 | $4,910 | $0 | $0 |
| 2020 | $461 | $3,270 | $0 | $0 |
| 2019 | $462 | $3,274 | $396 | $2,878 |
| 2018 | $221 | $3,270 | $0 | $0 |
| 2017 | $232 | $3,270 | $0 | $0 |
| 2016 | $135 | $3,270 | $0 | $0 |
| 2015 | $343 | $3,270 | $0 | $0 |
| 2014 | $124 | $3,274 | $396 | $2,878 |
Source: Public Records
Map
Nearby Homes
- 4636 Moore Rd
- TBD Bazen Ln
- 4732 Armfield Rd
- 3020 Allen Rd
- 2524 Allen Rd
- 3101 Willow Creek Rd
- 4004 & 3924 Redbird Rd
- 2556 Poor Farm Rd
- 2067 Willow Creek Rd
- 1518 E Effingham Rd
- 1801 Poor Farm Rd
- 616 Edge Creek Ln
- 608 Edge Creek Ln
- 1424 & 1426 Pamplico Hwy
- 3122 Pleasant Valley Cir
- 4835 Willow Creek Rd
- 1718 Tuxedo Jct
- 1715 Tuxedo Jct
- 1717 Tuxedo Jct
- 1716 Tuxedo Jct
- 4214 Armfield Rd
- 4140 Armfield Rd
- 4132 Armfield Rd
- 4225 Armfield Rd
- 4128 Armfield Rd
- 4124 Armfield Rd
- 6428 Peace Ave
- 6420 Peace Ave
- 4239 Armfield Rd
- 6416 Peace Ave
- 4112 Armfield Rd
- 4109 Armfield Rd
- 4103 Fulton Ave
- 4106 Armfield Rd
- 6521 Brooklyn Ave
- 4104 Fulton Ave
- 6422 Erica Ave
- 4101 Armfield Rd
- 648 Erica Ave
- 6418 Erica Ave