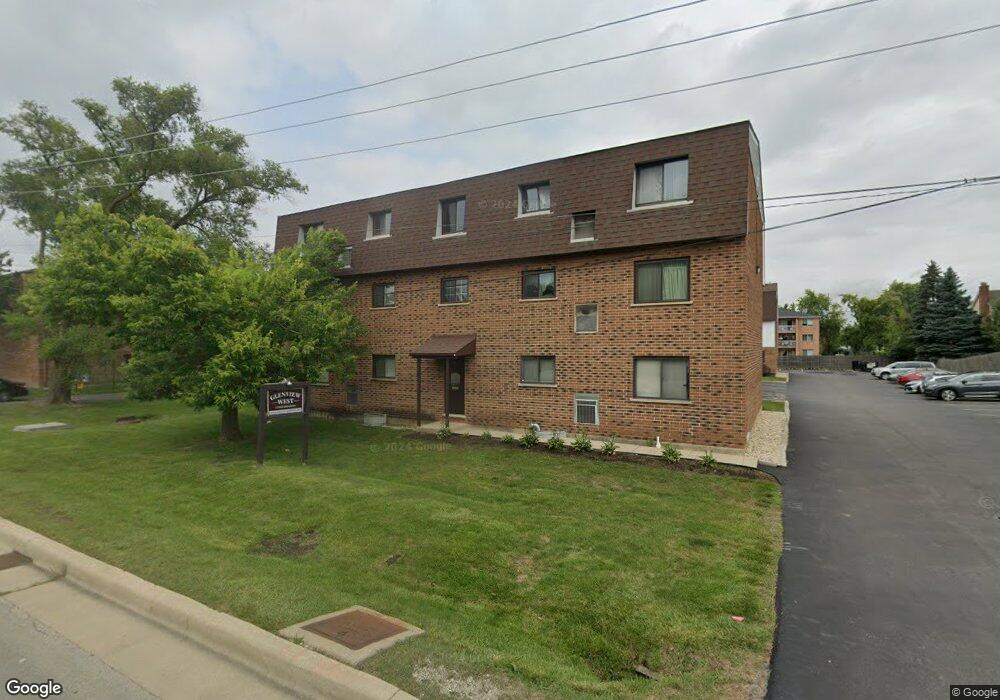
4202 Central Rd Unit 1 Glenview, IL 60025
Estimated Value: $201,000 - $225,000
3
Beds
--
Bath
28,299
Sq Ft
$8/Sq Ft
Est. Value
About This Home
This home is located at 4202 Central Rd Unit 1, Glenview, IL 60025 and is currently estimated at $214,587, approximately $7 per square foot. 4202 Central Rd Unit 1 is a home located in Cook County with nearby schools including Henking Elementary School, Hoffman Elementary School, and Springman Middle School.
Ownership History
Date
Name
Owned For
Owner Type
Purchase Details
Closed on
Apr 27, 2017
Sold by
Ladd Diane P Kawa
Bought by
Dababneh Ramiz
Current Estimated Value
Home Financials for this Owner
Home Financials are based on the most recent Mortgage that was taken out on this home.
Original Mortgage
$115,850
Interest Rate
4.45%
Mortgage Type
New Conventional
Purchase Details
Closed on
May 12, 2008
Sold by
Vale Irene J and Vale William J
Bought by
Vale Irene J and Irene J Vale Declaration Of Trust
Home Financials for this Owner
Home Financials are based on the most recent Mortgage that was taken out on this home.
Original Mortgage
$80,000
Interest Rate
6.01%
Mortgage Type
New Conventional
Purchase Details
Closed on
Jun 1, 2005
Sold by
Vale Irene J
Bought by
Vale Irene J and Irene J Vale Declaration To Trust
Create a Home Valuation Report for This Property
The Home Valuation Report is an in-depth analysis detailing your home's value as well as a comparison with similar homes in the area
Home Values in the Area
Average Home Value in this Area
Purchase History
| Date | Buyer | Sale Price | Title Company |
|---|---|---|---|
| Dababneh Ramiz | $123,000 | Attorney | |
| Vale Irene J | -- | Multiple | |
| Vale Irene J | -- | -- |
Source: Public Records
Mortgage History
| Date | Status | Borrower | Loan Amount |
|---|---|---|---|
| Previous Owner | Dababneh Ramiz | $115,850 | |
| Previous Owner | Vale Irene J | $80,000 |
Source: Public Records
Tax History
| Year | Tax Paid | Tax Assessment Tax Assessment Total Assessment is a certain percentage of the fair market value that is determined by local assessors to be the total taxable value of land and additions on the property. | Land | Improvement |
|---|---|---|---|---|
| 2025 | $2,156 | $17,096 | $2,432 | $14,664 |
| 2024 | $2,156 | $15,131 | $2,058 | $13,073 |
| 2023 | $1,992 | $15,131 | $2,058 | $13,073 |
| 2022 | $1,992 | $15,131 | $2,058 | $13,073 |
| 2021 | $2,407 | $12,465 | $1,403 | $11,062 |
| 2020 | $2,407 | $12,465 | $1,403 | $11,062 |
| 2019 | $3,214 | $14,800 | $1,403 | $13,397 |
| 2018 | $2,176 | $8,972 | $1,122 | $7,850 |
| 2017 | $2,116 | $8,972 | $1,122 | $7,850 |
| 2016 | $1,994 | $8,972 | $1,122 | $7,850 |
| 2015 | $471 | $6,393 | $982 | $5,411 |
| 2014 | $484 | $6,393 | $982 | $5,411 |
| 2013 | $446 | $6,393 | $982 | $5,411 |
Source: Public Records
Map
Nearby Homes
- 3925 Triumvera Dr Unit 10B
- 638 Naples Ct Unit T23C
- 3700 Capri Ct Unit 206
- 3700 Capri Ct Unit 308
- 3801 Appian Way Unit 403
- 3732 Capri Ct Unit T18A
- 10347 Dearlove Rd Unit 302
- 10467 Dearlove Rd Unit 6
- 9517 W Central Rd
- 9078 W Heathwood Dr Unit 5
- 9078 W Heathwood Dr Unit 1M
- 9375 Hamilton Ct Unit E
- 3505 Linneman St
- 9813 Bianco Terrace Unit D
- 606 Greendale Rd
- 9701 N Dee Rd Unit 6M
- 9118 W Elmwood Dr Unit 3K
- 9731 N Fox Glen Dr Unit 5C
- 1002 Castilian Ct Unit B302
- 1026 Castilian Ct Unit D162
- 4202 Central Rd Unit 1
- 4202 Central Rd Unit 1E
- 4202 Central Rd Unit 1
- 4202 Central Rd Unit 1
- 4202 Central Rd Unit 1
- 4202 Central Rd Unit 1D
- 4202 Central Rd Unit 1F
- 4204 Central Rd Unit 2
- 4204 Central Rd Unit 2
- 4204 Central Rd Unit 2
- 4204 Central Rd Unit 2
- 4204 Central Rd Unit 2
- 4204 Central Rd Unit 2
- 4204 Central Rd Unit 2B
- 4204 Central Rd Unit 2A
- 4206 Central Rd Unit 3
- 4206 Central Rd Unit 3
- 4206 Central Rd Unit 3
- 4206 Central Rd Unit 3
Your Personal Tour Guide
Ask me questions while you tour the home.