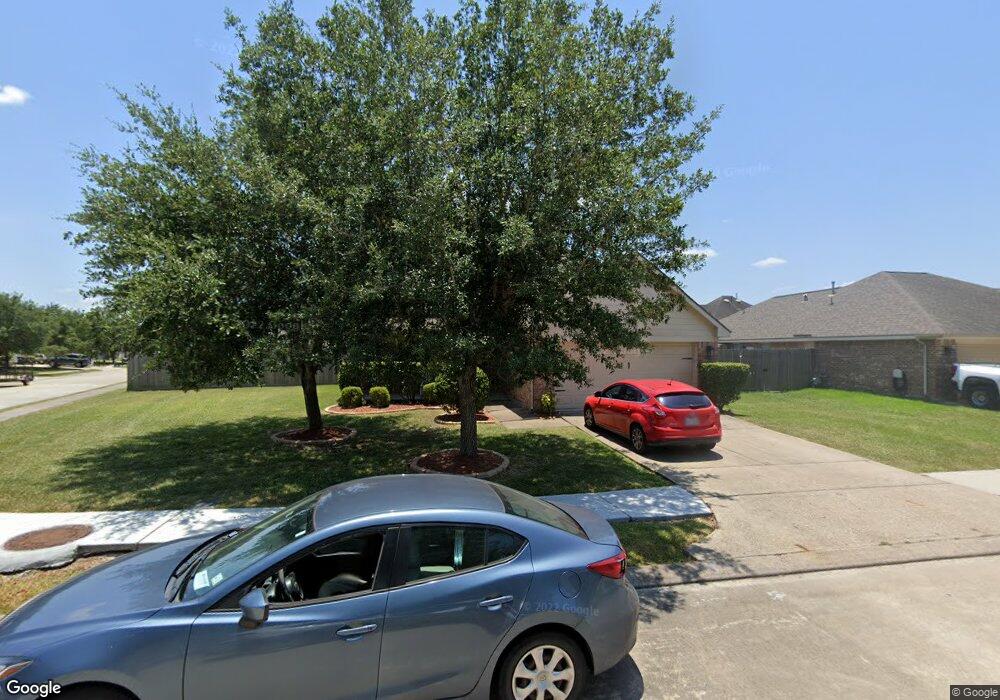
4202 Keystone Trail Pearland, TX 77584
Estimated Value: $278,573 - $335,000
--
Bed
3
Baths
2,020
Sq Ft
$156/Sq Ft
Est. Value
About This Home
This home is located at 4202 Keystone Trail, Pearland, TX 77584 and is currently estimated at $314,143, approximately $155 per square foot. 4202 Keystone Trail is a home located in Brazoria County with nearby schools including C.J. Harris Elementary School, Pearland Junior High School East, and Alexander Middle School.
Ownership History
Date
Name
Owned For
Owner Type
Purchase Details
Closed on
Jan 10, 2017
Sold by
Johnson Joshua and Johnson Jaime
Bought by
Johnson Joshua and Johnson Jaime
Current Estimated Value
Home Financials for this Owner
Home Financials are based on the most recent Mortgage that was taken out on this home.
Original Mortgage
$145,519
Outstanding Balance
$119,921
Interest Rate
4.12%
Mortgage Type
FHA
Estimated Equity
$194,222
Purchase Details
Closed on
Apr 27, 2006
Sold by
Lennar Homes Of Texas
Bought by
Johnson Joshua and Znidarsic Jaime
Home Financials for this Owner
Home Financials are based on the most recent Mortgage that was taken out on this home.
Original Mortgage
$30,848
Interest Rate
6.36%
Mortgage Type
Stand Alone Second
Create a Home Valuation Report for This Property
The Home Valuation Report is an in-depth analysis detailing your home's value as well as a comparison with similar homes in the area
Home Values in the Area
Average Home Value in this Area
Purchase History
| Date | Buyer | Sale Price | Title Company |
|---|---|---|---|
| Johnson Joshua | -- | None Available | |
| Johnson Joshua | -- | North American Title Co | |
| Lennar Homes Of Texas Sales & Mktg Ltd | -- | North American Title Co |
Source: Public Records
Mortgage History
| Date | Status | Borrower | Loan Amount |
|---|---|---|---|
| Open | Johnson Joshua | $145,519 | |
| Closed | Lennar Homes Of Texas Sales & Mktg Ltd | $30,848 | |
| Closed | Johnson Joshua | $123,350 |
Source: Public Records
Tax History Compared to Growth
Tax History
| Year | Tax Paid | Tax Assessment Tax Assessment Total Assessment is a certain percentage of the fair market value that is determined by local assessors to be the total taxable value of land and additions on the property. | Land | Improvement |
|---|---|---|---|---|
| 2025 | $5,318 | $280,005 | $36,360 | $251,130 |
| 2023 | $5,318 | $256,970 | $33,560 | $223,410 |
| 2022 | $7,492 | $236,660 | $33,560 | $203,100 |
| 2021 | $7,401 | $219,000 | $30,770 | $188,230 |
| 2020 | $6,969 | $219,000 | $30,770 | $188,230 |
| 2019 | $6,337 | $180,090 | $27,970 | $152,120 |
| 2018 | $6,316 | $180,090 | $27,970 | $152,120 |
| 2017 | $6,148 | $174,640 | $27,970 | $146,670 |
| 2016 | $6,010 | $174,640 | $27,970 | $146,670 |
| 2014 | $5,036 | $152,280 | $27,970 | $124,310 |
Source: Public Records
Map
Nearby Homes
- 4304 Keystone Trail
- 2808 Tranquility Trail
- 4505 Cedar Hill Dr
- 3804 Lancer Cir
- 4609 Buescher Ct
- 4610 Meridian Park Dr
- 2521 S Houston Ave
- 2515 S Houston Ave
- 2517 S Houston Ave
- 2519 S Houston Ave
- 2511 S Houston Ave
- Oliver Plan at Pearland Old Townsite
- Cooley Plan at Pearland Old Townsite
- Allen Plan at Pearland Old Townsite
- Sloan Plan at Pearland Old Townsite
- Carter Plan at Pearland Old Townsite
- Hunter Plan at Pearland Old Townsite
- 2505 S Houston Ave
- 2422-2436 S Main St
- 2728 Osprey Ln
- 4204 Keystone Trail
- 4203 Brazos Bend Dr
- 4201 Brazos Bend Dr
- 2703 Waterside Trail
- 2701 Waterside Trail
- 4205 Brazos Bend Dr
- 4206 Keystone Trail
- 4203 Keystone Trail
- 4205 Keystone Trail
- 2705 Waterside Trail
- 4201 Keystone Trail
- 4207 Keystone Trail
- 4207 Brazos Bend Dr
- 4208 Keystone Trail
- 2707 Waterside Trail
- 4209 Keystone Trail
- 4204 Brazos Bend Dr
- 4209 Brazos Bend Dr
- 4202 Brazos Bend Dr
- 4210 Keystone Trail