Estimated Value: $483,573 - $500,000
3
Beds
3
Baths
1,982
Sq Ft
$247/Sq Ft
Est. Value
About This Home
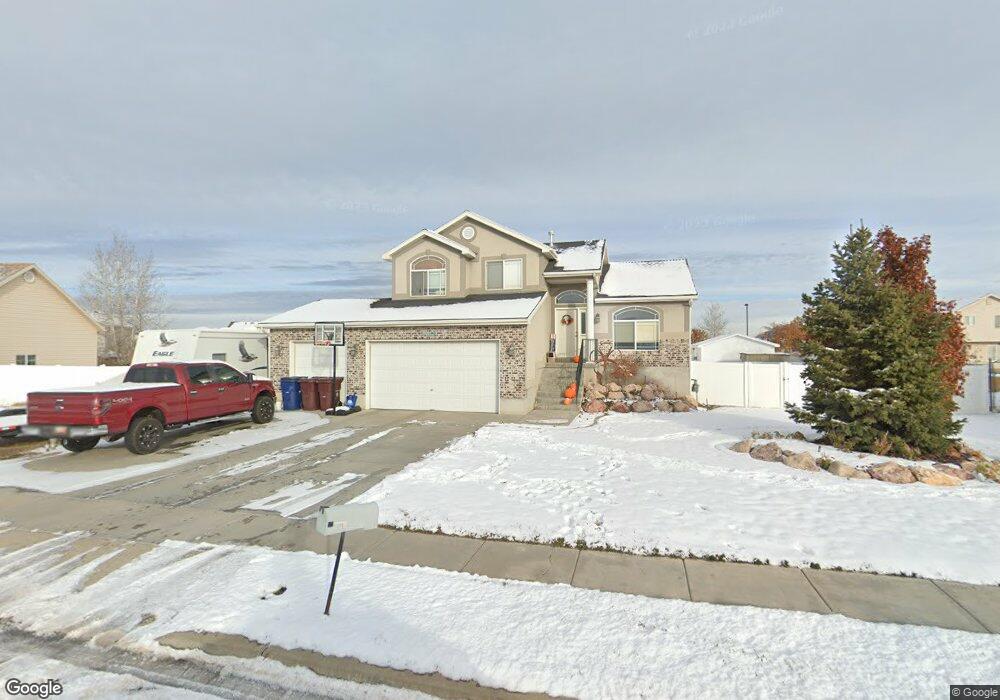
This home is located at 4202 W 5900 S, Roy, UT 84067 and is currently estimated at $489,393, approximately $246 per square foot. 4202 W 5900 S is a home located in Weber County with nearby schools including Freedom School, Roy Junior High School, and Roy High School.
Ownership History
Date
Name
Owned For
Owner Type
Purchase Details
Closed on
Aug 30, 2006
Sold by
Cole Quentin B and Cole Anna L
Bought by
Holt Nathan
Current Estimated Value
Home Financials for this Owner
Home Financials are based on the most recent Mortgage that was taken out on this home.
Original Mortgage
$194,350
Outstanding Balance
$117,286
Interest Rate
6.76%
Mortgage Type
Purchase Money Mortgage
Estimated Equity
$372,107
Purchase Details
Closed on
Mar 25, 2005
Sold by
Great American Homes Inc
Bought by
Cole Quentin B and Cole Anna L
Home Financials for this Owner
Home Financials are based on the most recent Mortgage that was taken out on this home.
Original Mortgage
$173,709
Interest Rate
5.53%
Mortgage Type
FHA
Create a Home Valuation Report for This Property
The Home Valuation Report is an in-depth analysis detailing your home's value as well as a comparison with similar homes in the area
Home Values in the Area
Average Home Value in this Area
Purchase History
| Date | Buyer | Sale Price | Title Company |
|---|---|---|---|
| Holt Nathan | -- | First American Title | |
| Cole Quentin B | -- | Bonneville Title Company Cle |
Source: Public Records
Mortgage History
| Date | Status | Borrower | Loan Amount |
|---|---|---|---|
| Open | Holt Nathan | $194,350 | |
| Previous Owner | Cole Quentin B | $173,709 |
Source: Public Records
Tax History Compared to Growth
Tax History
| Year | Tax Paid | Tax Assessment Tax Assessment Total Assessment is a certain percentage of the fair market value that is determined by local assessors to be the total taxable value of land and additions on the property. | Land | Improvement |
|---|---|---|---|---|
| 2025 | $2,841 | $453,155 | $159,810 | $293,345 |
| 2024 | $2,776 | $245,299 | $87,895 | $157,404 |
| 2023 | $2,875 | $256,300 | $87,172 | $169,128 |
| 2022 | $2,690 | $244,750 | $70,359 | $174,391 |
| 2021 | $2,325 | $349,000 | $87,126 | $261,874 |
| 2020 | $2,244 | $310,000 | $87,126 | $222,874 |
| 2019 | $2,147 | $279,000 | $56,636 | $222,364 |
| 2018 | $2,089 | $256,000 | $56,636 | $199,364 |
| 2017 | $1,953 | $224,000 | $56,636 | $167,364 |
| 2016 | $1,855 | $114,256 | $30,802 | $83,454 |
| 2015 | $1,620 | $101,375 | $30,802 | $70,573 |
| 2014 | $1,625 | $100,704 | $30,802 | $69,902 |
Source: Public Records
Map
Nearby Homes