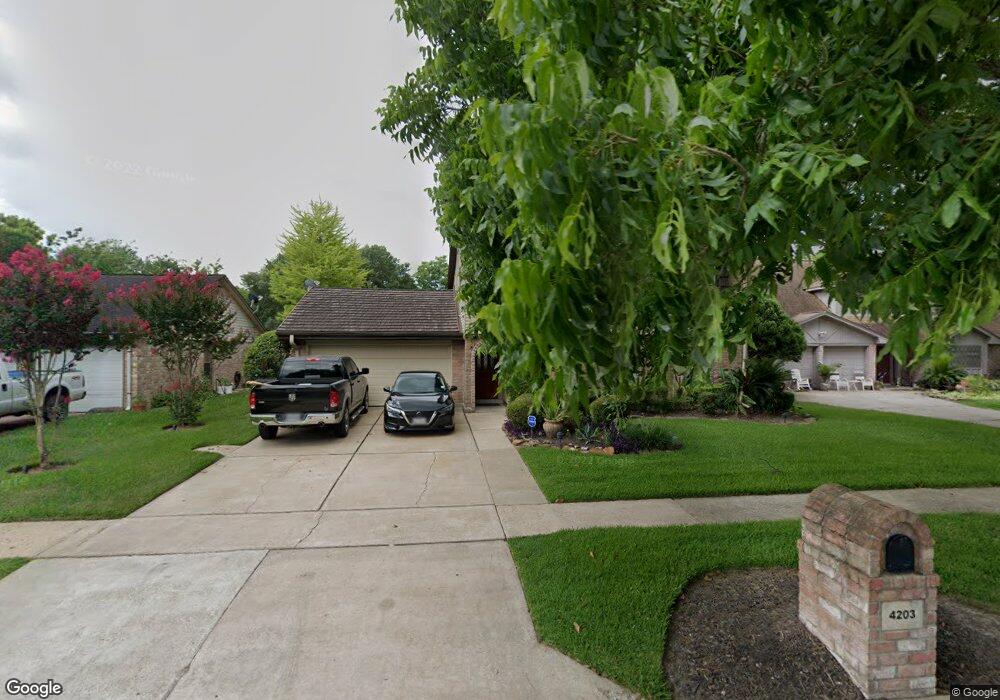
4203 R V Mayfield Dr Houston, TX 77088
Greater Inwood NeighborhoodEstimated Value: $238,000 - $253,000
4
Beds
3
Baths
1,914
Sq Ft
$128/Sq Ft
Est. Value
About This Home
This home is located at 4203 R V Mayfield Dr, Houston, TX 77088 and is currently estimated at $244,767, approximately $127 per square foot. 4203 R V Mayfield Dr is a home located in Harris County with nearby schools including Stovall School, Caraway Intermediate School, and Caraway Elementary School.
Ownership History
Date
Name
Owned For
Owner Type
Purchase Details
Closed on
Mar 29, 2019
Sold by
Ortiz Gabriel and Ortiz Hermelinda
Bought by
Ortiz Claudia J and Espinoza Christian G
Current Estimated Value
Purchase Details
Closed on
Feb 28, 1996
Sold by
Liles Helen
Bought by
Ortiz Gabriel and Ortiz Hermelinda
Home Financials for this Owner
Home Financials are based on the most recent Mortgage that was taken out on this home.
Original Mortgage
$52,150
Outstanding Balance
$2,042
Interest Rate
7.01%
Estimated Equity
$242,725
Purchase Details
Closed on
Dec 22, 1995
Sold by
Liles James Butler
Bought by
Liles Helen Demny
Home Financials for this Owner
Home Financials are based on the most recent Mortgage that was taken out on this home.
Original Mortgage
$54,900
Interest Rate
7.31%
Create a Home Valuation Report for This Property
The Home Valuation Report is an in-depth analysis detailing your home's value as well as a comparison with similar homes in the area
Home Values in the Area
Average Home Value in this Area
Purchase History
| Date | Buyer | Sale Price | Title Company |
|---|---|---|---|
| Ortiz Claudia J | -- | None Available | |
| Ortiz Gabriel | -- | Title Agency #40 | |
| Liles Helen Demny | -- | -- |
Source: Public Records
Mortgage History
| Date | Status | Borrower | Loan Amount |
|---|---|---|---|
| Open | Ortiz Gabriel | $52,150 | |
| Previous Owner | Liles Helen Demny | $54,900 |
Source: Public Records
Tax History Compared to Growth
Tax History
| Year | Tax Paid | Tax Assessment Tax Assessment Total Assessment is a certain percentage of the fair market value that is determined by local assessors to be the total taxable value of land and additions on the property. | Land | Improvement |
|---|---|---|---|---|
| 2025 | $4,860 | $211,012 | $50,994 | $160,018 |
| 2024 | $4,860 | $214,137 | $50,994 | $163,143 |
| 2023 | $4,860 | $234,311 | $50,994 | $183,317 |
| 2022 | $4,842 | $201,866 | $42,792 | $159,074 |
| 2021 | $4,193 | $166,946 | $35,660 | $131,286 |
| 2020 | $4,019 | $152,256 | $35,660 | $116,596 |
| 2019 | $3,449 | $124,656 | $18,543 | $106,113 |
| 2018 | $1,170 | $108,711 | $18,543 | $90,168 |
| 2017 | $2,567 | $108,711 | $18,543 | $90,168 |
| 2016 | $2,334 | $114,052 | $18,543 | $95,509 |
| 2015 | $1,552 | $99,236 | $18,543 | $80,693 |
| 2014 | $1,552 | $83,975 | $18,543 | $65,432 |
Source: Public Records
Map
Nearby Homes
- 4206 Saratoga Dr
- 4306 Saratoga Dr
- 7611 Athlone Dr
- 4015 Black Locust Dr
- 7707 Inwood Grove Ln
- 7705 Inwood Grove Ln
- 5514 Long Creek Ln
- 7808 Inwood Grove Ln
- 7718 Inwood Grove Ln
- 7716 Inwood Grove Ln
- 7712 Inwood Grove Ln
- 7814 Inwood Grove Ln
- 5606 Water Leaf Ln
- 7717 Inwood Hills Ln
- 7709 Inwood Hills Ln
- DOVE Plan at Alaia Crossing
- CEDAR Plan at Alaia Crossing
- BOXWOOD Plan at Alaia Crossing
- 7816 Inwood Grove Ln
- 5519 Council Grove Ln
- 4203 Mayfield Oaks Ln
- 4111 Mayfield Oaks Ln
- 4207 Mayfield Oaks Ln
- 4107 Mayfield Oaks Ln
- 4202 Saratoga Dr
- 4211 R V Mayfield Dr
- 4211 Mayfield Oaks Ln
- 4110 Saratoga Dr
- 4106 Saratoga Dr
- 4210 Saratoga Dr
- 4202 Mayfield Oaks Ln
- 4103 Mayfield Oaks Ln
- 4110 R V Mayfield Dr
- 4110 Mayfield Oaks Ln
- 4303 Mayfield Oaks Ln
- 4206 R V Mayfield Dr
- 4206 Mayfield Oaks Ln
- 4106 Mayfield Oaks Ln
- 4102 Saratoga Dr
- 4210 Mayfield Oaks Ln