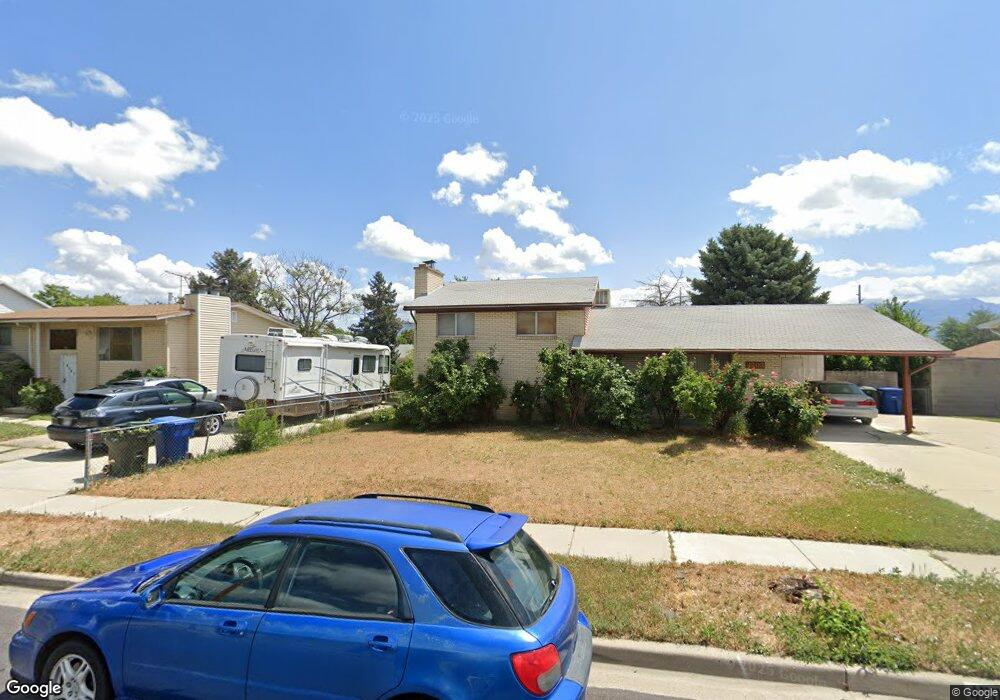
4203 S 2785 W Salt Lake City, UT 84119
Granger NeighborhoodEstimated Value: $426,000 - $429,000
3
Beds
2
Baths
1,066
Sq Ft
$401/Sq Ft
Est. Value
About This Home
This home is located at 4203 S 2785 W, Salt Lake City, UT 84119 and is currently estimated at $427,294, approximately $400 per square foot. 4203 S 2785 W is a home located in Salt Lake County with nearby schools including Rolling Meadows Elementary School, Valley Junior High School, and Granger High School.
Ownership History
Date
Name
Owned For
Owner Type
Purchase Details
Closed on
Nov 5, 2005
Sold by
Truong Khanh
Bought by
Nguyen Hue Cam
Current Estimated Value
Purchase Details
Closed on
Jul 22, 1994
Sold by
Mecham Ruth F
Bought by
Nguyen Hue Cam and Truong Khanh
Home Financials for this Owner
Home Financials are based on the most recent Mortgage that was taken out on this home.
Original Mortgage
$62,800
Interest Rate
7.79%
Mortgage Type
Purchase Money Mortgage
Create a Home Valuation Report for This Property
The Home Valuation Report is an in-depth analysis detailing your home's value as well as a comparison with similar homes in the area
Home Values in the Area
Average Home Value in this Area
Purchase History
| Date | Buyer | Sale Price | Title Company |
|---|---|---|---|
| Nguyen Hue Cam | -- | None Available | |
| Nguyen Hue Cam | -- | -- |
Source: Public Records
Mortgage History
| Date | Status | Borrower | Loan Amount |
|---|---|---|---|
| Previous Owner | Nguyen Hue Cam | $62,800 |
Source: Public Records
Tax History Compared to Growth
Tax History
| Year | Tax Paid | Tax Assessment Tax Assessment Total Assessment is a certain percentage of the fair market value that is determined by local assessors to be the total taxable value of land and additions on the property. | Land | Improvement |
|---|---|---|---|---|
| 2025 | $2,064 | $341,700 | $128,400 | $213,300 |
| 2024 | $2,064 | $328,600 | $121,700 | $206,900 |
| 2023 | $2,049 | $310,800 | $117,000 | $193,800 |
| 2022 | $1,857 | $282,700 | $114,700 | $168,000 |
| 2021 | $1,726 | $233,400 | $88,200 | $145,200 |
| 2020 | $1,588 | $202,800 | $78,000 | $124,800 |
| 2019 | $1,564 | $192,900 | $73,600 | $119,300 |
| 2018 | $1,576 | $187,500 | $73,600 | $113,900 |
| 2017 | $1,400 | $169,800 | $73,600 | $96,200 |
| 2016 | $1,205 | $146,800 | $73,600 | $73,200 |
| 2015 | $1,271 | $147,600 | $72,800 | $74,800 |
| 2014 | $1,244 | $141,600 | $70,600 | $71,000 |
Source: Public Records
Map
Nearby Homes
- 4216 S Solitude Ridge Unit B
- 4244 S 2835 W
- 4165 S 2700 W Unit 2D
- 2752 W Berwick Place
- 4153 S 2700 W Unit 1G
- 4318 S King Arthur Dr
- 4111 S Greyhackle Ln
- 4162 S Alice Way
- 4107 S Greyhackle Ln
- 2507 W Dutch Draw Dr
- 4077 Tralee Cir
- 3018 W 4100 S
- 2451 Hard Rock Cir S
- 4115 S Middlepark Ln Unit 22
- 2409 W Hardrock Dr
- 2892 Roxborough Ct
- 2717 W Redwick Ct
- 2845 Marcus Rd S
- 4482 S Stonington Way
- 4483 S Parkbury Way