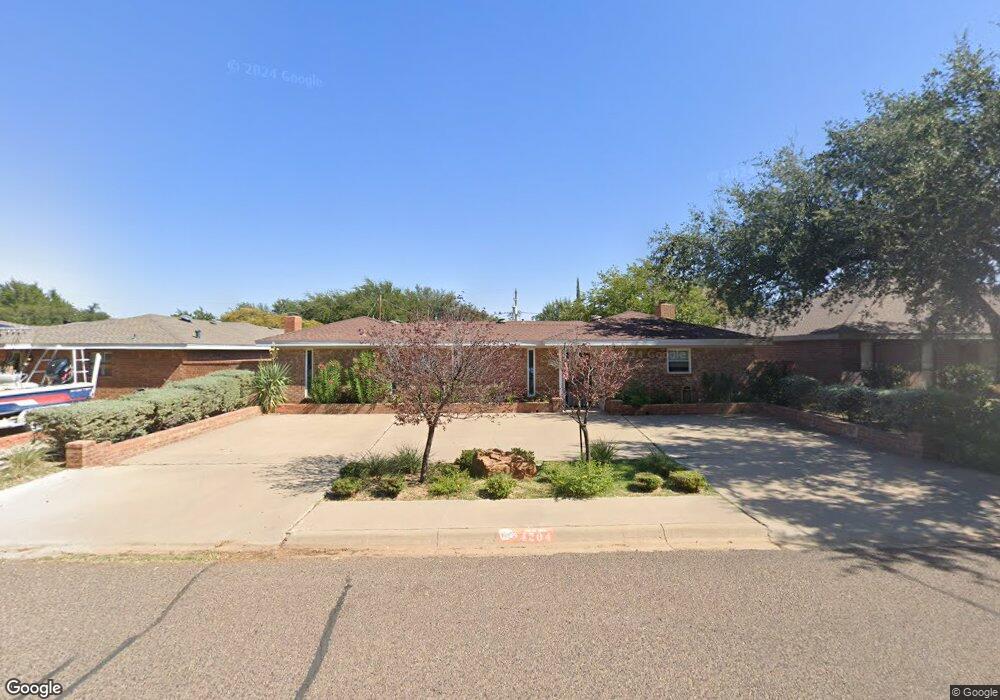
4204 Boulder Dr Midland, TX 79707
Skyline Terrace NeighborhoodEstimated Value: $383,104 - $434,000
--
Bed
2
Baths
2,417
Sq Ft
$168/Sq Ft
Est. Value
About This Home
This home is located at 4204 Boulder Dr, Midland, TX 79707 and is currently estimated at $406,776, approximately $168 per square foot. 4204 Boulder Dr is a home located in Midland County with nearby schools including Parker Elementary School, Alamo Junior High School, and Robert H. Goddard Junior High School.
Ownership History
Date
Name
Owned For
Owner Type
Purchase Details
Closed on
Jun 5, 2013
Sold by
Graham Robb
Bought by
Manly George C and Manly Kay L
Current Estimated Value
Home Financials for this Owner
Home Financials are based on the most recent Mortgage that was taken out on this home.
Original Mortgage
$200,000
Outstanding Balance
$141,083
Interest Rate
3.38%
Mortgage Type
New Conventional
Estimated Equity
$265,693
Purchase Details
Closed on
Jan 31, 2013
Sold by
Graham Robb
Bought by
Graham Robb
Purchase Details
Closed on
May 22, 2012
Sold by
Graham Robb
Bought by
Graham Ross
Purchase Details
Closed on
May 21, 2012
Sold by
Graham Julia Ann
Bought by
Manly George C
Purchase Details
Closed on
Apr 1, 1987
Bought by
Manly George C
Purchase Details
Closed on
Aug 21, 1979
Bought by
Manly George C
Create a Home Valuation Report for This Property
The Home Valuation Report is an in-depth analysis detailing your home's value as well as a comparison with similar homes in the area
Home Values in the Area
Average Home Value in this Area
Purchase History
| Date | Buyer | Sale Price | Title Company |
|---|---|---|---|
| Manly George C | -- | None Available | |
| Graham Robb | -- | None Available | |
| Graham Ross | -- | None Available | |
| Graham Ross A | -- | None Available | |
| Manly George C | -- | -- | |
| Manly George C | -- | -- | |
| Manly George C | -- | -- |
Source: Public Records
Mortgage History
| Date | Status | Borrower | Loan Amount |
|---|---|---|---|
| Open | Manly George C | $200,000 |
Source: Public Records
Tax History Compared to Growth
Tax History
| Year | Tax Paid | Tax Assessment Tax Assessment Total Assessment is a certain percentage of the fair market value that is determined by local assessors to be the total taxable value of land and additions on the property. | Land | Improvement |
|---|---|---|---|---|
| 2025 | $2,525 | $336,620 | $18,900 | $317,720 |
| 2024 | $2,531 | $349,330 | $18,900 | $330,430 |
| 2023 | $2,397 | $327,450 | $18,900 | $308,550 |
| 2022 | $4,971 | $318,190 | $18,900 | $299,290 |
| 2021 | $5,297 | $304,040 | $18,900 | $285,140 |
| 2020 | $3,932 | $296,130 | $18,900 | $277,230 |
| 2019 | $5,606 | $296,130 | $18,900 | $277,230 |
| 2018 | $5,496 | $282,690 | $18,900 | $263,790 |
| 2017 | $5,343 | $274,810 | $18,900 | $255,910 |
| 2016 | $4,845 | $256,720 | $18,900 | $237,820 |
| 2015 | -- | $254,770 | $18,900 | $235,870 |
| 2014 | -- | $245,280 | $0 | $0 |
Source: Public Records
Map
Nearby Homes
- 4200 Boulder Dr
- 4303 Arroyo Dr
- 3901 Arroyo Dr
- 4203 Skyline Dr
- 4313 Valley Dr
- 3907 Westminister Dr
- 4700 Boulder Dr Unit 710
- 4700 Boulder Dr Unit 611
- 4700 Boulder Dr Unit 103
- 4700 Boulder Dr Unit 303
- 4700 Boulder Dr Unit 1112
- 4700 Boulder Dr Unit 1504
- 4700 Boulder Dr Unit 1605
- 4700 Boulder Dr
- 4700 Boulder Dr Unit 1303
- 4700 Boulder Dr Unit 1601
- 4700 Boulder Dr Unit 902
- 4700 Boulder Dr Unit 1008
- 4003 Compton Dr
- 4500 Westminister Dr
- 4206 Boulder Dr
- 4202 Boulder Dr
- 4208 Boulder Dr
- 4203 Arroyo Dr
- 4207 Arroyo Dr
- 4207 Boulder Dr
- 4209 Boulder Dr
- 4205 Boulder Dr
- 4209 Arroyo Dr
- 4201 Arroyo Dr
- 4211 Boulder Dr
- 4203 Boulder Dr
- 4201 Boulder Dr
- 4300 Boulder Dr
- 4008 Godfrey St
- 4010 Godfrey St
- 4202 Arroyo Dr
- 4204 Arroyo Dr
- 4301 Arroyo Dr
- 4103 Boulder Dr