Estimated Value: $431,312 - $464,000
3
Beds
1
Bath
1,165
Sq Ft
$382/Sq Ft
Est. Value
About This Home
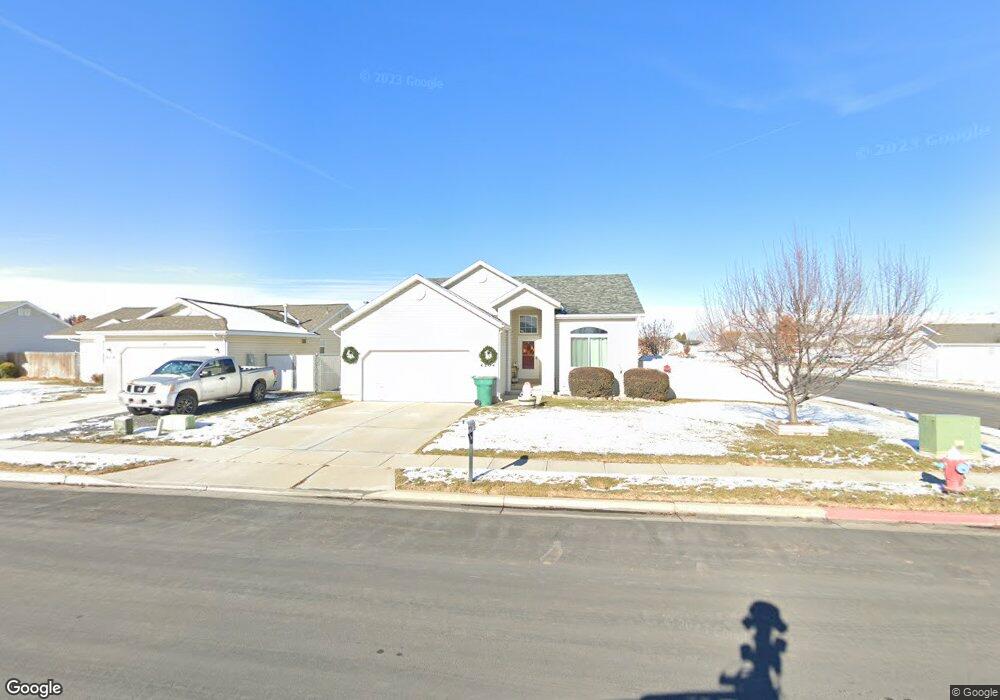
This home is located at 4204 W 5250 S Unit 11, Roy, UT 84067 and is currently estimated at $445,328, approximately $382 per square foot. 4204 W 5250 S Unit 11 is a home located in Weber County with nearby schools including Country View School, Rocky Mountain Junior High School, and Roy High School.
Ownership History
Date
Name
Owned For
Owner Type
Purchase Details
Closed on
Oct 5, 2023
Sold by
Beauchene Paul L and Beauchene Gaelene G
Bought by
Paul L Beauchene And Gaelene G Beauchene Revo and Beauchene
Current Estimated Value
Purchase Details
Closed on
Jul 9, 2005
Sold by
Winegrad Arthur D and Winegrad Nikki E
Bought by
Beauchene Paul L
Home Financials for this Owner
Home Financials are based on the most recent Mortgage that was taken out on this home.
Original Mortgage
$135,850
Interest Rate
5.55%
Mortgage Type
Fannie Mae Freddie Mac
Purchase Details
Closed on
Aug 23, 2000
Sold by
Alpine Homes Inc
Bought by
Winegard Arthur D
Home Financials for this Owner
Home Financials are based on the most recent Mortgage that was taken out on this home.
Original Mortgage
$120,600
Interest Rate
8.15%
Mortgage Type
Purchase Money Mortgage
Create a Home Valuation Report for This Property
The Home Valuation Report is an in-depth analysis detailing your home's value as well as a comparison with similar homes in the area
Home Values in the Area
Average Home Value in this Area
Purchase History
| Date | Buyer | Sale Price | Title Company |
|---|---|---|---|
| Paul L Beauchene And Gaelene G Beauchene Revo | -- | None Listed On Document | |
| Beauchene Paul L | -- | First American Title | |
| Winegard Arthur D | -- | First American Title |
Source: Public Records
Mortgage History
| Date | Status | Borrower | Loan Amount |
|---|---|---|---|
| Previous Owner | Beauchene Paul L | $135,850 | |
| Previous Owner | Winegard Arthur D | $120,600 |
Source: Public Records
Tax History Compared to Growth
Tax History
| Year | Tax Paid | Tax Assessment Tax Assessment Total Assessment is a certain percentage of the fair market value that is determined by local assessors to be the total taxable value of land and additions on the property. | Land | Improvement |
|---|---|---|---|---|
| 2025 | $2,647 | $420,224 | $128,561 | $291,663 |
| 2024 | $2,561 | $224,949 | $70,708 | $154,241 |
| 2023 | $2,560 | $226,050 | $66,744 | $159,306 |
| 2022 | $2,633 | $239,800 | $58,938 | $180,862 |
| 2021 | $2,070 | $308,000 | $81,562 | $226,438 |
| 2020 | $1,987 | $272,000 | $81,562 | $190,438 |
| 2019 | $1,904 | $245,000 | $46,247 | $198,753 |
| 2018 | $1,751 | $211,000 | $43,303 | $167,697 |
| 2017 | $1,651 | $186,000 | $43,303 | $142,697 |
| 2016 | $1,608 | $97,499 | $22,430 | $75,069 |
| 2015 | $1,422 | $87,538 | $22,430 | $65,108 |
| 2014 | $1,415 | $86,140 | $19,696 | $66,444 |
Source: Public Records
Map
Nearby Homes
- 5270 S 4200 W
- 4218 W 5050 S
- 5116 S 4300 W
- 5013 S 4150 W
- 4990 S 4075 W
- 4021 W 5000 S
- 5235 Midland Dr
- 4890 S 4075 W
- 4141 W 4875 S
- 4337 W 5430 S Unit A
- 4106 W 4875 S
- 4342 W 5430 S Unit B
- 4309 W 5430 St #B S
- 5465 S 4050 W
- 4449 W 5325 S
- 4097 W 4750 S
- 5539 S 4175 W
- 4756 S 4300 W
- 3820 Foxglen Dr
- 3766 W 5300 S
- 4204 W 5250 S
- 4216 W 5250 S
- 4216 W 5250 S Unit 10
- 4196 W 5250 S
- 4196 W 5250 S Unit 12
- 4228 W 5250 S
- 4228 W 5250 S Unit 9
- 4195 W 5075 S
- 4205 W 5250 S
- 4217 W 5250 S
- 4180 W 5250 S
- 4180 W 5250 S Unit 13
- 4240 W 5250 S
- 4240 W 5250 S Unit 8
- 4193 W 5250 S
- 4189 W 5075 S
- 4229 W 5250 S
- 4241 W 5250 S
- 4252 W 5250 S
- 4252 W 5250 S Unit 7