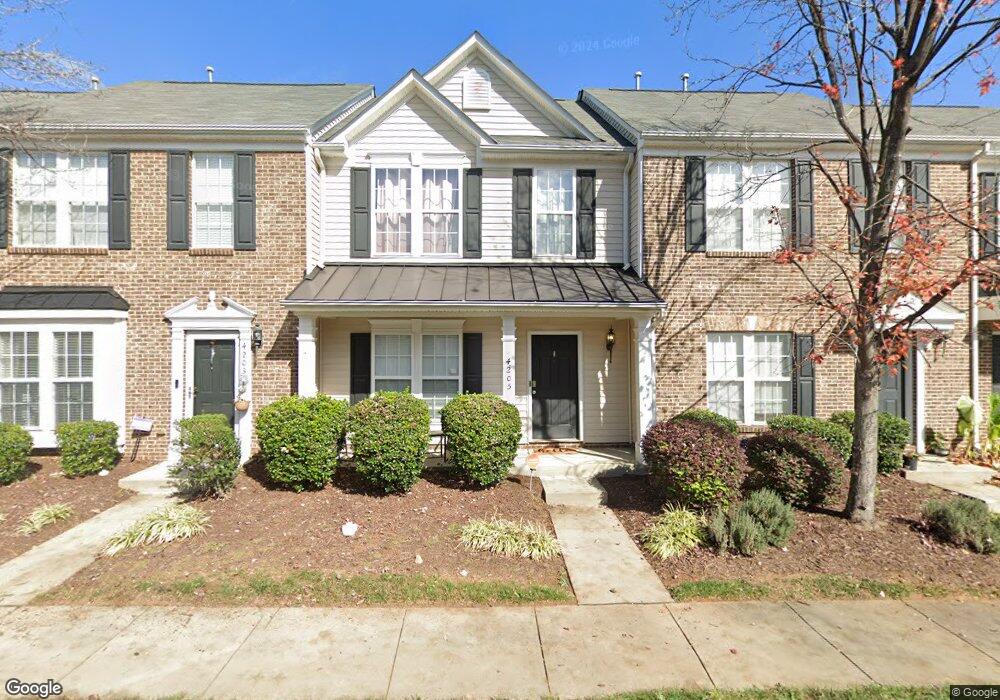
4205 Coulter Crossing Unit LOT 141 Charlotte, NC 28213
Estimated Value: $263,030 - $284,000
2
Beds
3
Baths
1,474
Sq Ft
$184/Sq Ft
Est. Value
About This Home
This home is located at 4205 Coulter Crossing Unit LOT 141, Charlotte, NC 28213 and is currently estimated at $271,758, approximately $184 per square foot. 4205 Coulter Crossing Unit LOT 141 is a home located in Cabarrus County with nearby schools including Harrisburg Elementary School, Hickory Ridge Middle, and Hickory Ridge High School.
Ownership History
Date
Name
Owned For
Owner Type
Purchase Details
Closed on
Jul 10, 2018
Sold by
Lail Sarah
Bought by
Bropleh Belicia
Current Estimated Value
Home Financials for this Owner
Home Financials are based on the most recent Mortgage that was taken out on this home.
Original Mortgage
$144,337
Outstanding Balance
$126,099
Interest Rate
4.87%
Mortgage Type
FHA
Estimated Equity
$145,659
Purchase Details
Closed on
Jan 8, 2016
Sold by
Us Bank Na
Bought by
Lail Sarah
Purchase Details
Closed on
Nov 12, 2015
Sold by
Malchesky Jeffrey Raymond
Bought by
U S Bank N A
Purchase Details
Closed on
Dec 22, 2006
Sold by
Nvr Inc
Bought by
Malchesky Jeffrey Raymond
Home Financials for this Owner
Home Financials are based on the most recent Mortgage that was taken out on this home.
Original Mortgage
$116,271
Interest Rate
12%
Mortgage Type
Balloon
Create a Home Valuation Report for This Property
The Home Valuation Report is an in-depth analysis detailing your home's value as well as a comparison with similar homes in the area
Home Values in the Area
Average Home Value in this Area
Purchase History
| Date | Buyer | Sale Price | Title Company |
|---|---|---|---|
| Bropleh Belicia | $147,000 | None Available | |
| Lail Sarah | $93,500 | None Available | |
| U S Bank N A | $82,400 | None Available | |
| Malchesky Jeffrey Raymond | $129,500 | None Available |
Source: Public Records
Mortgage History
| Date | Status | Borrower | Loan Amount |
|---|---|---|---|
| Open | Bropleh Belicia | $144,337 | |
| Previous Owner | Malchesky Jeffrey Raymond | $116,271 |
Source: Public Records
Tax History Compared to Growth
Tax History
| Year | Tax Paid | Tax Assessment Tax Assessment Total Assessment is a certain percentage of the fair market value that is determined by local assessors to be the total taxable value of land and additions on the property. | Land | Improvement |
|---|---|---|---|---|
| 2025 | $2,351 | $238,390 | $70,000 | $168,390 |
| 2024 | $2,351 | $238,390 | $70,000 | $168,390 |
| 2023 | $1,822 | $155,080 | $40,000 | $115,080 |
| 2022 | $1,822 | $155,080 | $40,000 | $115,080 |
| 2021 | $1,698 | $155,080 | $40,000 | $115,080 |
| 2020 | $1,698 | $155,080 | $40,000 | $115,080 |
| 2019 | $1,172 | $106,990 | $15,000 | $91,990 |
| 2018 | $1,150 | $106,990 | $15,000 | $91,990 |
| 2017 | $1,059 | $106,990 | $15,000 | $91,990 |
| 2016 | $1,059 | $106,870 | $16,000 | $90,870 |
| 2015 | $748 | $106,870 | $16,000 | $90,870 |
| 2014 | $748 | $106,870 | $16,000 | $90,870 |
Source: Public Records
Map
Nearby Homes
- 4208 Coulter Crossing
- 4214 Coulter Crossing
- 4235 Coulter Crossing
- 5116 Sunburst Ln
- 440 Nathaniel Dale Place Unit BRX0041
- 437 Nathaniel Dale Place Unit BRX0034
- 429 Nathaniel Dale Place Unit BRX0032
- 408 Nathaniel Dale Place Unit BRX0053
- 412 Nathaniel Dale Place Unit BRX0052
- 6010 Albiza Dr
- 8015 Frances Haven Dr
- 8915 Merrie Rose Ave
- 3317 Wymering Rd
- 3220 Barons Court Rd
- 1139 Grays Mill Rd
- 3414 Broadwick St
- 8320 Camelot Dr
- 8817 Arrington Hall
- 5730 Clear Creek Ln
- 8928 Morning Mist Rd
- 4207 Coulter Crossing
- 4205 Coulter Crossing
- 4209 Coulter Crossing
- 4203 Coulter Crossing
- 4213 Coulter Crossing
- 4215 Coulter Crossing
- 4201 Coulter Crossing
- 4217 Coulter Crossing
- 4219 Coulter Crossing
- 4204 Coulter Crossing
- 4204 Coulter Crossing Unit 208
- 4206 Coulter Crossing
- 4202 Coulter Crossing
- 4200 Coulter Crossing
- 4216 Coulter Crossing
- 16234 Hayfield Rd Unit 16234
- 16234 Hayfield Rd
- 16234 Hayfield Rd
- 16234 Hayfield Rd Unit 136
- 16230 Hayfield Rd