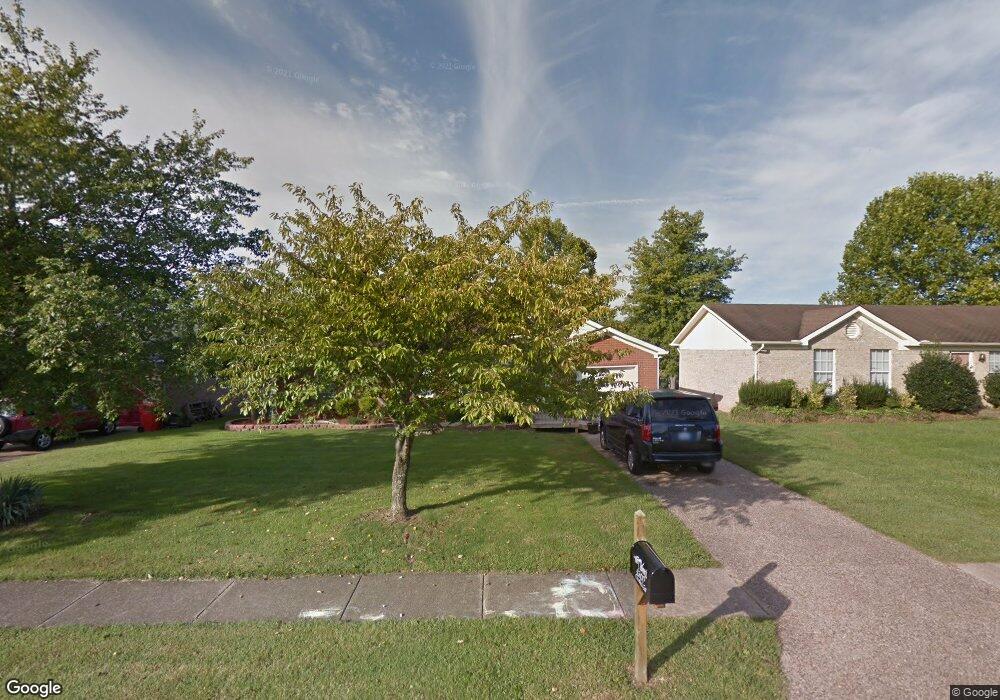
4205 Glenbrook E New Albany, IN 47150
Estimated Value: $225,000 - $265,000
3
Beds
2
Baths
1,163
Sq Ft
$204/Sq Ft
Est. Value
About This Home
This home is located at 4205 Glenbrook E, New Albany, IN 47150 and is currently estimated at $237,625, approximately $204 per square foot. 4205 Glenbrook E is a home located in Floyd County with nearby schools including Grant Line School, Nathaniel Scribner Middle School, and New Albany Senior High School.
Ownership History
Date
Name
Owned For
Owner Type
Purchase Details
Closed on
Oct 10, 2024
Sold by
Dabney Timothy D and Dabney Deborah K
Bought by
Dabney Deborah K
Current Estimated Value
Purchase Details
Closed on
Oct 12, 2007
Sold by
B & T Equity Ventures Llc
Bought by
Daborah Timothy D and Dabncy Deborah K
Purchase Details
Closed on
Jun 20, 2007
Sold by
Toole Matthew
Bought by
B&T Equity Ventures Llc
Purchase Details
Closed on
Jun 15, 2007
Sold by
Jackson Alponso
Bought by
Toole Matthew
Purchase Details
Closed on
Feb 26, 2007
Sold by
Washington Mutual Bank
Bought by
Secretary Of Housing & Urban Development
Purchase Details
Closed on
Jan 26, 2007
Sold by
Soddders Tracy L and Sodders Lisa K
Bought by
Washington Mutual Bank
Create a Home Valuation Report for This Property
The Home Valuation Report is an in-depth analysis detailing your home's value as well as a comparison with similar homes in the area
Home Values in the Area
Average Home Value in this Area
Purchase History
| Date | Buyer | Sale Price | Title Company |
|---|---|---|---|
| Dabney Deborah K | -- | None Listed On Document | |
| Daborah Timothy D | -- | None Available | |
| B&T Equity Ventures Llc | -- | None Available | |
| Toole Matthew | -- | Village Title Inc | |
| Secretary Of Housing & Urban Development | -- | None Available | |
| Washington Mutual Bank | $101,562 | None Available |
Source: Public Records
Tax History Compared to Growth
Tax History
| Year | Tax Paid | Tax Assessment Tax Assessment Total Assessment is a certain percentage of the fair market value that is determined by local assessors to be the total taxable value of land and additions on the property. | Land | Improvement |
|---|---|---|---|---|
| 2024 | $1,007 | $186,900 | $22,400 | $164,500 |
| 2023 | $1,002 | $162,500 | $22,400 | $140,100 |
| 2022 | $930 | $158,100 | $22,400 | $135,700 |
| 2021 | $912 | $143,100 | $22,400 | $120,700 |
| 2020 | $841 | $134,600 | $22,400 | $112,200 |
| 2019 | $805 | $133,600 | $22,400 | $111,200 |
| 2018 | $765 | $132,400 | $22,400 | $110,000 |
| 2017 | $687 | $116,300 | $22,400 | $93,900 |
| 2016 | $626 | $115,200 | $22,400 | $92,800 |
| 2014 | $647 | $109,500 | $22,400 | $87,100 |
| 2013 | -- | $102,700 | $22,400 | $80,300 |
Source: Public Records
Map
Nearby Homes
- Dogwood Plan at Kamer Crossing
- Holly Plan at Kamer Crossing
- Maple Plan at Kamer Crossing
- Haylyn 48' Plan at Kamer Crossing
- Juliana Plan at Kamer Crossing
- Willow Plan at Kamer Crossing
- 4216 - LOT 130 Skylar Way
- 4509 Chris Ct
- 3920 Windsor Creek Dr
- 4834 Ashbury Dr
- 3941 Carver St
- 1111 Teal Ridge Ct
- 5307 Grant Line Rd
- 3829 Fiske Ave
- 3810 Wayne St
- 4724 Timber Pine Dr Unit 100
- 4722 Timber Pine Dr Unit 99
- BERKSHIRE Plan at Jefferson Gardens
- AUBURN Plan at Jefferson Gardens
- 4724 Black Pine Blvd Unit 73
- 4203 Glenbrook E
- 4207 Glenbrook E
- 4209 Glenbrook E
- 4201 Glenbrook E
- 4206 Glenbrook W
- 4204 Glenbrook W
- 4208 Glenbrook W
- 4206 Glenbrook E
- 4210 Glenbrook W
- 4211 Glenbrook E
- 4204 Glenbrook E
- 4208 Glenbrook E
- 4202 Glenbrook E
- 4210 Glenbrook E
- 4212 Glenbrook W
- 4215 Glenbrook E
- 4212 Glenbrook E
- 4214 Glenbrook W
- 4217 Glenbrook E
- 4205 Glenbrook W