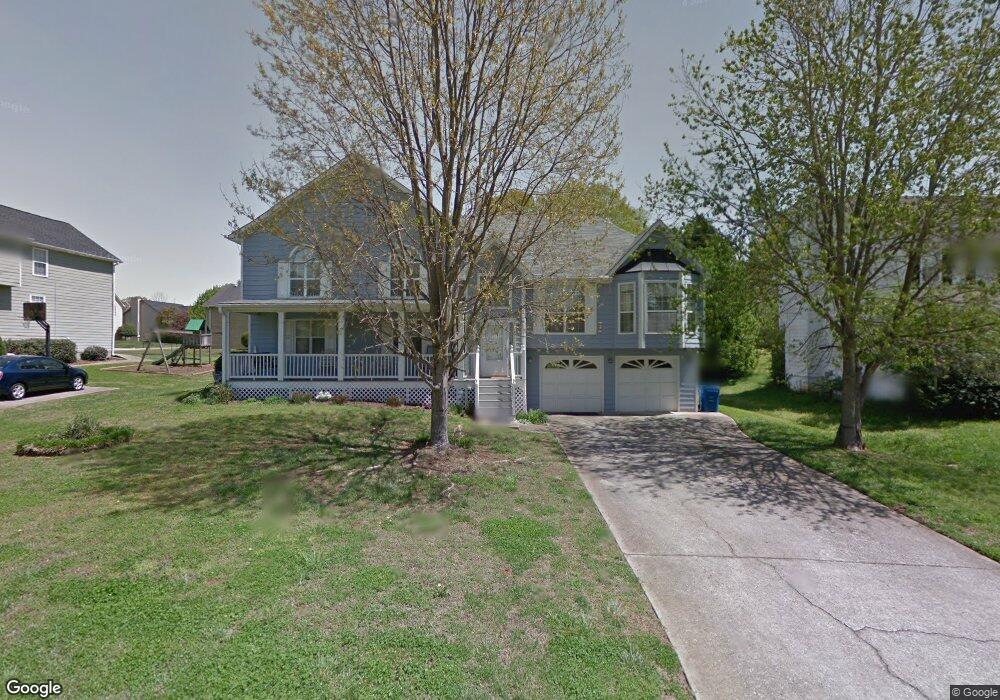
4205 Pullman Ct Unit III Austell, GA 30106
Estimated Value: $326,000 - $373,000
4
Beds
4
Baths
1,715
Sq Ft
$203/Sq Ft
Est. Value
About This Home
This home is located at 4205 Pullman Ct Unit III, Austell, GA 30106 and is currently estimated at $348,812, approximately $203 per square foot. 4205 Pullman Ct Unit III is a home located in Cobb County with nearby schools including Deerwood Elementary School, Russell Elementary School, and Floyd Middle School.
Ownership History
Date
Name
Owned For
Owner Type
Purchase Details
Closed on
Aug 26, 2020
Sold by
Stone Taylor Carol
Bought by
Stone Taylor Carol and Mungo Amani
Current Estimated Value
Purchase Details
Closed on
Oct 29, 2002
Sold by
Mcmurray Charles A
Bought by
Taylor Carol S
Home Financials for this Owner
Home Financials are based on the most recent Mortgage that was taken out on this home.
Original Mortgage
$140,000
Outstanding Balance
$54,779
Interest Rate
5.25%
Mortgage Type
New Conventional
Estimated Equity
$294,033
Purchase Details
Closed on
May 26, 1998
Sold by
Newsome G B and Newsome Carol
Bought by
Mcmurray Chas A and Mcmurray Brenda
Home Financials for this Owner
Home Financials are based on the most recent Mortgage that was taken out on this home.
Original Mortgage
$118,000
Interest Rate
7.21%
Mortgage Type
New Conventional
Create a Home Valuation Report for This Property
The Home Valuation Report is an in-depth analysis detailing your home's value as well as a comparison with similar homes in the area
Home Values in the Area
Average Home Value in this Area
Purchase History
| Date | Buyer | Sale Price | Title Company |
|---|---|---|---|
| Stone Taylor Carol | -- | None Available | |
| Taylor Carol S | $175,000 | -- | |
| Mcmurray Chas A | $147,500 | -- |
Source: Public Records
Mortgage History
| Date | Status | Borrower | Loan Amount |
|---|---|---|---|
| Open | Taylor Carol S | $140,000 | |
| Previous Owner | Mcmurray Chas A | $118,000 |
Source: Public Records
Tax History Compared to Growth
Tax History
| Year | Tax Paid | Tax Assessment Tax Assessment Total Assessment is a certain percentage of the fair market value that is determined by local assessors to be the total taxable value of land and additions on the property. | Land | Improvement |
|---|---|---|---|---|
| 2025 | $858 | $143,028 | $22,000 | $121,028 |
| 2024 | $861 | $143,028 | $22,000 | $121,028 |
| 2023 | $655 | $143,028 | $22,000 | $121,028 |
| 2022 | $756 | $107,844 | $16,000 | $91,844 |
| 2021 | $695 | $87,296 | $16,000 | $71,296 |
| 2020 | $695 | $87,296 | $16,000 | $71,296 |
| 2019 | $684 | $83,604 | $12,800 | $70,804 |
| 2018 | $684 | $83,604 | $12,800 | $70,804 |
| 2017 | $564 | $70,300 | $12,800 | $57,500 |
| 2016 | $566 | $70,300 | $12,800 | $57,500 |
| 2015 | $565 | $60,552 | $12,000 | $48,552 |
| 2014 | $575 | $60,552 | $0 | $0 |
Source: Public Records
Map
Nearby Homes
- 1097 Trestle Dr
- 4072 Elsdon Dr
- 936 Tyrell Dr
- 4201 Regal Ridge Rd
- 1240 Parktown Dr Unit 4
- 895 Tyrell Dr
- 1146 Silvergate Ln
- 1406 Yates Ave
- 3864 Guilderoy Ln Unit 3
- 1078 Hibiscus Way SW
- 3869 Merryweather Trail
- 1021 Wisteria Dr SW
- 3712 Auldyn Dr
- 4200 Citizen Cir Unit 3
- 4187 Alaina Cir Unit 18
- 960 Verlander Trail
- 4406 Yelverton Place
- 4209 Pullman Ct
- 1060 Trestle Dr
- 1056 Trestle Dr
- 4213 Pullman Ct
- 4180 Pullman Ln
- 4204 Pullman Ct
- 4200 Pullman Ct Unit 3
- 4200 Pullman Ct Unit 4200
- 4208 Pullman Ct
- 4176 Pullman Ln
- 4184 Pullman Ln
- 1085 Trestle Dr
- 1089 Trestle Dr
- 4212 Pullman Ct
- 4188 Pullman Ln
- 1081 Trestle Dr Unit 3
- 1093 Trestle Dr Unit 3
- 1077 Trestle Dr
- 4221 Pullman Ct
- 1073 Trestle Dr