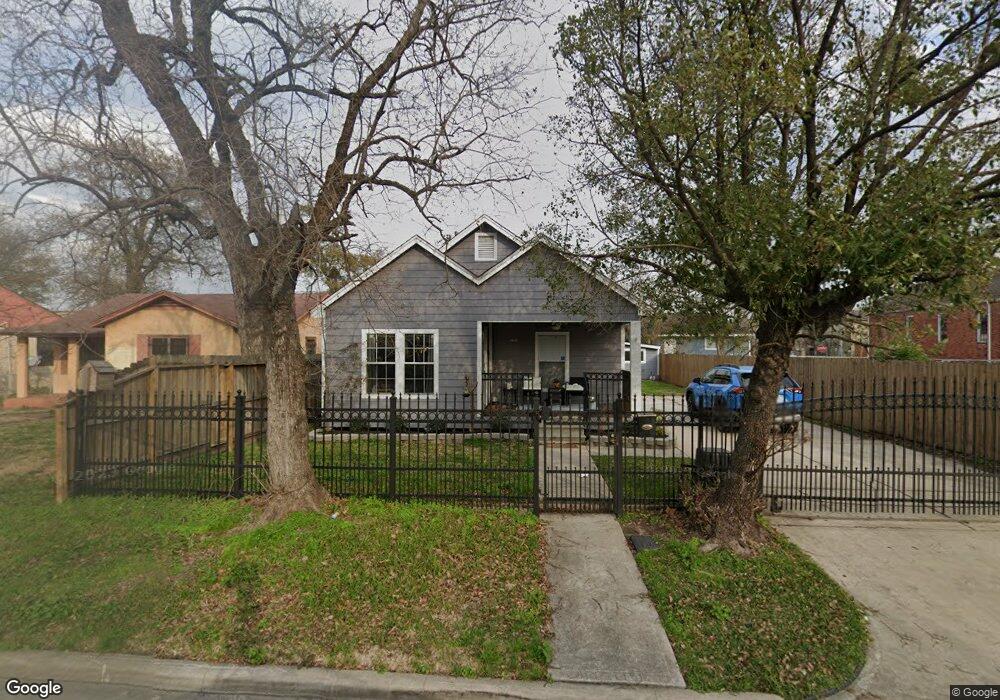
4206 Billingsley St Houston, TX 77009
Northside Village NeighborhoodEstimated Value: $268,000 - $338,000
3
Beds
2
Baths
1,027
Sq Ft
$295/Sq Ft
Est. Value
About This Home
This home is located at 4206 Billingsley St, Houston, TX 77009 and is currently estimated at $302,943, approximately $294 per square foot. 4206 Billingsley St is a home located in Harris County with nearby schools including Looscan Elementary School, Marshall Middle, and Northside High School.
Ownership History
Date
Name
Owned For
Owner Type
Purchase Details
Closed on
Feb 15, 2017
Sold by
Jurica Steven R
Bought by
Selvera Emily Jane
Current Estimated Value
Home Financials for this Owner
Home Financials are based on the most recent Mortgage that was taken out on this home.
Original Mortgage
$195,225
Outstanding Balance
$161,638
Interest Rate
4.2%
Mortgage Type
New Conventional
Estimated Equity
$141,305
Purchase Details
Closed on
Oct 31, 2007
Sold by
Carrillo Jose E and Carillo Maria
Bought by
Jurica Steven R
Home Financials for this Owner
Home Financials are based on the most recent Mortgage that was taken out on this home.
Original Mortgage
$112,500
Interest Rate
6.37%
Mortgage Type
Purchase Money Mortgage
Purchase Details
Closed on
Mar 30, 2005
Sold by
Harvey Kenneth L
Bought by
Carrillo Jose E
Create a Home Valuation Report for This Property
The Home Valuation Report is an in-depth analysis detailing your home's value as well as a comparison with similar homes in the area
Home Values in the Area
Average Home Value in this Area
Purchase History
| Date | Buyer | Sale Price | Title Company |
|---|---|---|---|
| Selvera Emily Jane | -- | Startex Title Co | |
| Jurica Steven R | -- | Ameripoint Title | |
| Carrillo Jose E | -- | First American Title |
Source: Public Records
Mortgage History
| Date | Status | Borrower | Loan Amount |
|---|---|---|---|
| Open | Selvera Emily Jane | $195,225 | |
| Previous Owner | Jurica Steven R | $112,500 |
Source: Public Records
Tax History Compared to Growth
Tax History
| Year | Tax Paid | Tax Assessment Tax Assessment Total Assessment is a certain percentage of the fair market value that is determined by local assessors to be the total taxable value of land and additions on the property. | Land | Improvement |
|---|---|---|---|---|
| 2025 | $4,233 | $313,338 | $211,750 | $101,588 |
| 2024 | $4,233 | $321,353 | $215,875 | $105,478 |
| 2023 | $4,233 | $321,353 | $215,875 | $105,478 |
| 2022 | $5,536 | $296,112 | $173,250 | $122,862 |
| 2021 | $5,328 | $228,584 | $115,500 | $113,084 |
| 2020 | $5,348 | $220,831 | $115,500 | $105,331 |
| 2019 | $5,122 | $224,730 | $110,000 | $114,730 |
| 2018 | $3,442 | $184,020 | $83,875 | $100,145 |
| 2017 | $4,653 | $184,020 | $83,875 | $100,145 |
| 2016 | $4,181 | $165,337 | $77,000 | $88,337 |
| 2015 | $2,386 | $138,200 | $55,000 | $83,200 |
| 2014 | $2,386 | $92,804 | $24,750 | $68,054 |
Source: Public Records
Map
Nearby Homes
- 4209 Billingsley St
- 4202 Billingsley St
- 4215 Edison St
- 4109 Edison St
- 4201 Averill St
- 4113 Averill St
- 4331 Cetti St
- 4401 Hain St
- 4502 Hain St
- 0 Frawley St
- 4307 Beggs St
- 4317 Beggs St
- 3906 Beggs St
- 1013 Erin St Unit M
- 1013 Erin St Unit S
- 1013 Erin St Unit U
- 1013 Erin St Unit V
- 3911 Kennon St Unit A
- 4607 Cetti St
- 324 Erin St
- 4210 Billingsley St
- 4214 Billingsley St
- 0 Irvinton Blvd
- 4201 Irvington Blvd
- 4211 Billingsley St
- 4207 Billingsley St
- 4215 Billingsley St
- 4312 Billingsley St
- 4217 Billingsley St
- 4119 Billingsley St
- 4314 Billingsley St
- 4115 Billingsley St
- 4221 Billingsley St
- 4206 Edison St
- 4210 Edison St
- 4111 Billingsley St
- 4214 Edison St
- 4305 Billingsley St
- 610 Patton St
- 4218 Edison St