Estimated Value: $337,000 - $357,000
3
Beds
3
Baths
1,580
Sq Ft
$217/Sq Ft
Est. Value
About This Home
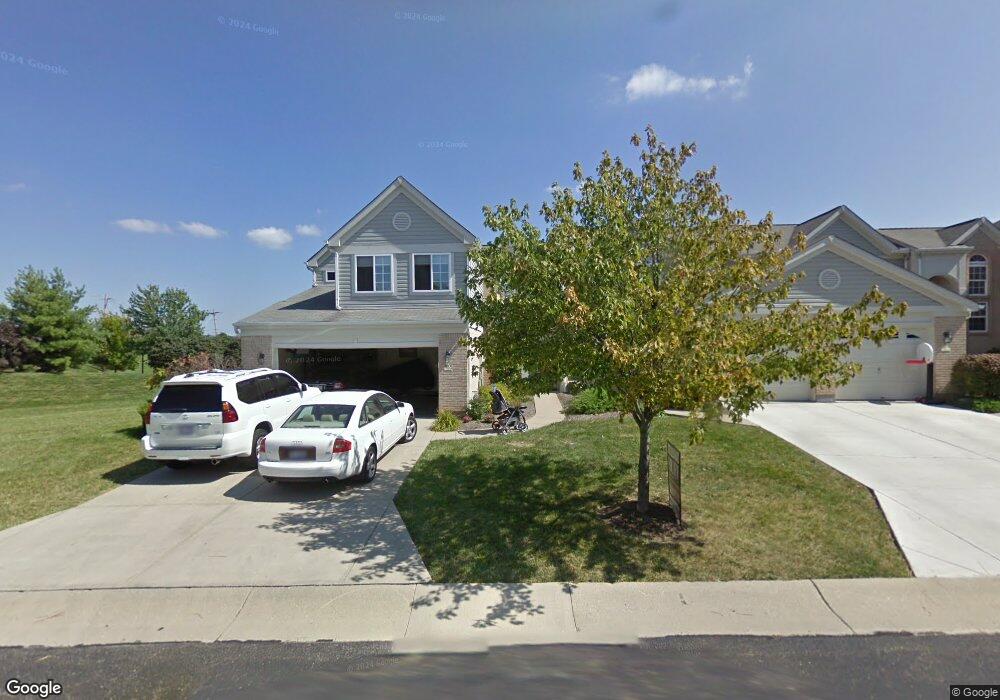
This home is located at 4206 East Village Dr Unit 174A, Mason, OH 45040 and is currently estimated at $343,518, approximately $217 per square foot. 4206 East Village Dr Unit 174A is a home located in Warren County with nearby schools including Mason Intermediate Elementary School, Mason Middle School, and William Mason High School.
Ownership History
Date
Name
Owned For
Owner Type
Purchase Details
Closed on
Oct 20, 2022
Sold by
Fikri Kenan T and Fikri Rory E
Bought by
Kondamudi Srinivas Surya Teja
Current Estimated Value
Home Financials for this Owner
Home Financials are based on the most recent Mortgage that was taken out on this home.
Original Mortgage
$280,250
Outstanding Balance
$269,645
Interest Rate
6.02%
Mortgage Type
New Conventional
Estimated Equity
$73,873
Purchase Details
Closed on
Oct 10, 2014
Sold by
Fiorini Vinton
Bought by
Fikri Ergun M
Purchase Details
Closed on
Jul 1, 2005
Sold by
Sikkema William J and Sikkema Dorothy
Bought by
Fiorini Vinton
Home Financials for this Owner
Home Financials are based on the most recent Mortgage that was taken out on this home.
Original Mortgage
$170,720
Interest Rate
5.68%
Mortgage Type
FHA
Purchase Details
Closed on
Apr 4, 1997
Sold by
Drees Co
Bought by
Dorothy William J and Dorothy Sikkema
Create a Home Valuation Report for This Property
The Home Valuation Report is an in-depth analysis detailing your home's value as well as a comparison with similar homes in the area
Home Values in the Area
Average Home Value in this Area
Purchase History
| Date | Buyer | Sale Price | Title Company |
|---|---|---|---|
| Kondamudi Srinivas Surya Teja | $295,000 | None Listed On Document | |
| Fikri Ergun M | $165,500 | Prodigy Title Agency | |
| Fiorini Vinton | $176,000 | Priority Land Title Agency | |
| Dorothy William J | $147,298 | -- |
Source: Public Records
Mortgage History
| Date | Status | Borrower | Loan Amount |
|---|---|---|---|
| Open | Kondamudi Srinivas Surya Teja | $280,250 | |
| Previous Owner | Fiorini Vinton | $170,720 |
Source: Public Records
Tax History Compared to Growth
Tax History
| Year | Tax Paid | Tax Assessment Tax Assessment Total Assessment is a certain percentage of the fair market value that is determined by local assessors to be the total taxable value of land and additions on the property. | Land | Improvement |
|---|---|---|---|---|
| 2024 | $3,807 | $93,810 | $24,500 | $69,310 |
| 2023 | $3,431 | $71,417 | $10,675 | $60,742 |
| 2022 | $3,387 | $71,418 | $10,675 | $60,743 |
| 2021 | $3,282 | $71,418 | $10,675 | $60,743 |
| 2020 | $3,147 | $58,538 | $8,750 | $49,788 |
| 2019 | $2,820 | $58,538 | $8,750 | $49,788 |
| 2018 | $2,829 | $58,538 | $8,750 | $49,788 |
| 2017 | $2,500 | $48,300 | $7,291 | $41,010 |
| 2016 | $2,109 | $48,300 | $7,291 | $41,010 |
| 2015 | $2,113 | $48,300 | $7,291 | $41,010 |
| 2014 | $2,587 | $45,140 | $6,810 | $38,330 |
| 2013 | $2,592 | $57,950 | $8,750 | $49,200 |
Source: Public Records
Map
Nearby Homes
- 6550 Villagefield Dr
- 4109 Old Manchester Ct
- 6674 Villager Place Unit 153D
- 6545 Farmbrooke Ct
- 6668 Pondfield Ln
- 6551 Farmbrooke Ct
- 4427 Towneside Ct
- 6768 Pondfield Ln Unit 271E
- 4762 Flagstone Dr
- 6788 Summer Field Dr
- 6557 Foxfield Dr
- 6309 Inverness Way
- 3900 St Andrews Ct
- 6416 Inverness Way
- 6303 Greenwood Ct
- 6292 Greenwood Ct
- 6334 Greenwood Ct
- 6279 Greenwood Ct
- 6346 Coverage Ct
- 6350 Coverage Ct
- 4206 E Village Dr
- 4202 E Village Dr
- 4202 East Village Dr
- 4200 East Village Dr
- 4198 East Village Dr
- 4198 E Village Dr
- 4217 East Village Dr Unit 175B
- 4217 E Village Dr
- 4215 E Village Dr
- 4215 East Village Dr
- 4194 E Village Dr
- 4194 East Village Dr Unit 173A
- 4190 East Village Dr Unit 173B
- 4190 E Village Dr
- 4188 E Village Dr
- 4188 East Village Dr Unit 173C
- 4186 East Village Dr
- 4186 East Village Dr Unit 1730
- 4186 E Village Dr
- 4186 E Village Dr Unit 1730