Estimated Value: $222,000 - $265,000
3
Beds
2
Baths
1,620
Sq Ft
$153/Sq Ft
Est. Value
About This Home
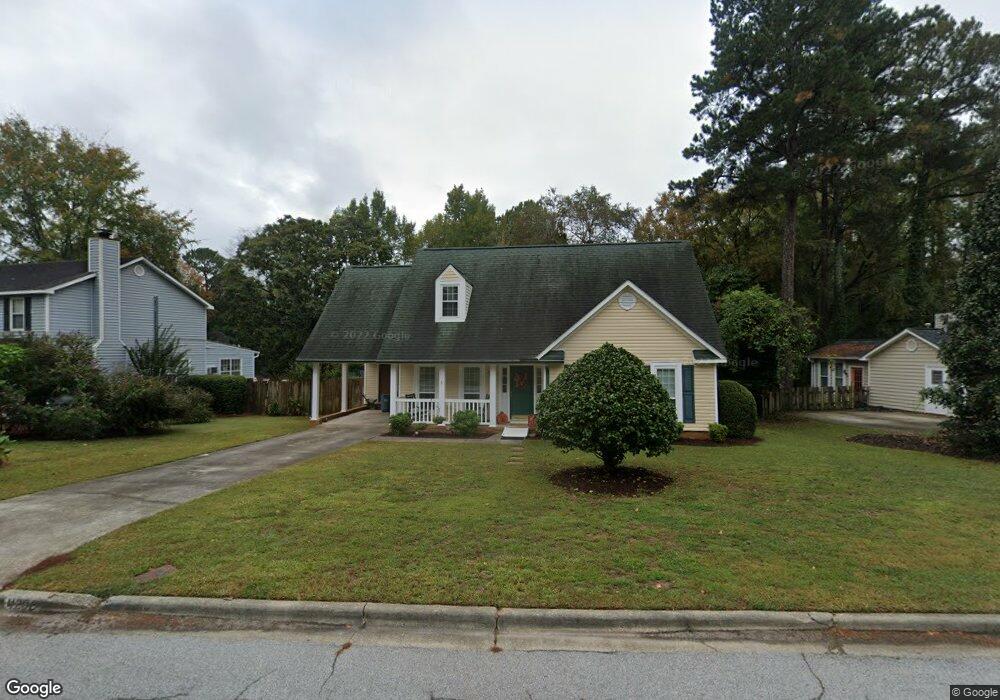
This home is located at 4206 Fairfield Cir, Evans, GA 30809 and is currently estimated at $248,662, approximately $153 per square foot. 4206 Fairfield Cir is a home located in Columbia County with nearby schools including Blue Ridge Elementary School, Lakeside Middle School, and Lakeside High School.
Ownership History
Date
Name
Owned For
Owner Type
Purchase Details
Closed on
May 12, 2005
Sold by
Mims Charles Ray
Bought by
Smith Donna W
Current Estimated Value
Home Financials for this Owner
Home Financials are based on the most recent Mortgage that was taken out on this home.
Original Mortgage
$103,920
Outstanding Balance
$53,697
Interest Rate
5.8%
Mortgage Type
New Conventional
Estimated Equity
$194,965
Purchase Details
Closed on
Feb 26, 2004
Sold by
Underwood Christopher
Bought by
Mims Charles Ray and Mims Tanya
Home Financials for this Owner
Home Financials are based on the most recent Mortgage that was taken out on this home.
Original Mortgage
$120,000
Interest Rate
5.63%
Mortgage Type
Purchase Money Mortgage
Purchase Details
Closed on
Apr 30, 2001
Sold by
Graham Floyd S and Graham Katrina R
Bought by
Underwood Christopher
Home Financials for this Owner
Home Financials are based on the most recent Mortgage that was taken out on this home.
Original Mortgage
$102,902
Interest Rate
6.9%
Mortgage Type
VA
Create a Home Valuation Report for This Property
The Home Valuation Report is an in-depth analysis detailing your home's value as well as a comparison with similar homes in the area
Home Values in the Area
Average Home Value in this Area
Purchase History
| Date | Buyer | Sale Price | Title Company |
|---|---|---|---|
| Smith Donna W | $129,900 | -- | |
| Mims Charles Ray | $120,000 | -- | |
| Underwood Christopher | $100,900 | -- |
Source: Public Records
Mortgage History
| Date | Status | Borrower | Loan Amount |
|---|---|---|---|
| Open | Smith Donna W | $103,920 | |
| Closed | Smith Donna W | $25,980 | |
| Previous Owner | Mims Charles Ray | $120,000 | |
| Previous Owner | Underwood Christopher | $102,902 |
Source: Public Records
Tax History
| Year | Tax Paid | Tax Assessment Tax Assessment Total Assessment is a certain percentage of the fair market value that is determined by local assessors to be the total taxable value of land and additions on the property. | Land | Improvement |
|---|---|---|---|---|
| 2025 | $2,199 | $91,712 | $20,499 | $71,213 |
| 2024 | $2,200 | $87,658 | $19,368 | $68,290 |
| 2023 | $2,200 | $82,991 | $17,940 | $65,051 |
| 2022 | $1,934 | $74,094 | $15,084 | $59,010 |
| 2021 | $1,739 | $63,747 | $14,064 | $49,683 |
| 2020 | $1,667 | $59,869 | $13,236 | $46,633 |
| 2019 | $1,706 | $61,250 | $12,648 | $48,602 |
| 2018 | $1,499 | $53,610 | $12,341 | $41,269 |
| 2017 | $1,559 | $55,568 | $11,443 | $44,125 |
| 2016 | $1,383 | $51,109 | $10,703 | $40,406 |
| 2015 | $1,342 | $49,498 | $10,440 | $39,058 |
| 2014 | $1,310 | $47,729 | $10,230 | $37,499 |
Source: Public Records
Map
Nearby Homes
- 4209 Fairfield Cir
- 0 Commons Dr
- 4176 Arlington Rd
- 455 Bristol Rd
- 427 Bristol Rd
- 417 Blue Ridge Dr
- 634 Kemper Dr
- 435 Evans Mill Dr Unit 17
- 4126 Dunes Dr
- 3991 High Chaparral Dr
- 340 Lamplighter Ln
- 386 Connor Cir
- 375 Connor Cir
- 218 Ryan Ln
- 2820 Old Riah Rd
- 452 Windtree Place
- 432 Old Evans Rd
- 3779 Winchester Trail
- 652 King Taylor Rd
- 4061 Briarwood Dr
- 4204 Fairfield Cir
- 4208 Fairfield Cir
- 542 Fairfield Way
- 4210 Fairfield Cir
- 544 Fairfield Way
- 4207 Fairfield Cir
- 4205 Fairfield Cir
- 4203 Fairfield Cir
- 4212 Fairfield Cir
- 548 Fairfield Way
- 4211 Fairfield Cir
- 4214 Fairfield Cir
- 4216 Fairfield Cir
- 539 Fairfield Way
- 4213 Fairfield Cir
- 543 Fairfield Way
- 541 Fairfield Way
- 4218 Fairfield Cir
- 537 Fairfield Way
- 550 Fairfield Way
Your Personal Tour Guide
Ask me questions while you tour the home.