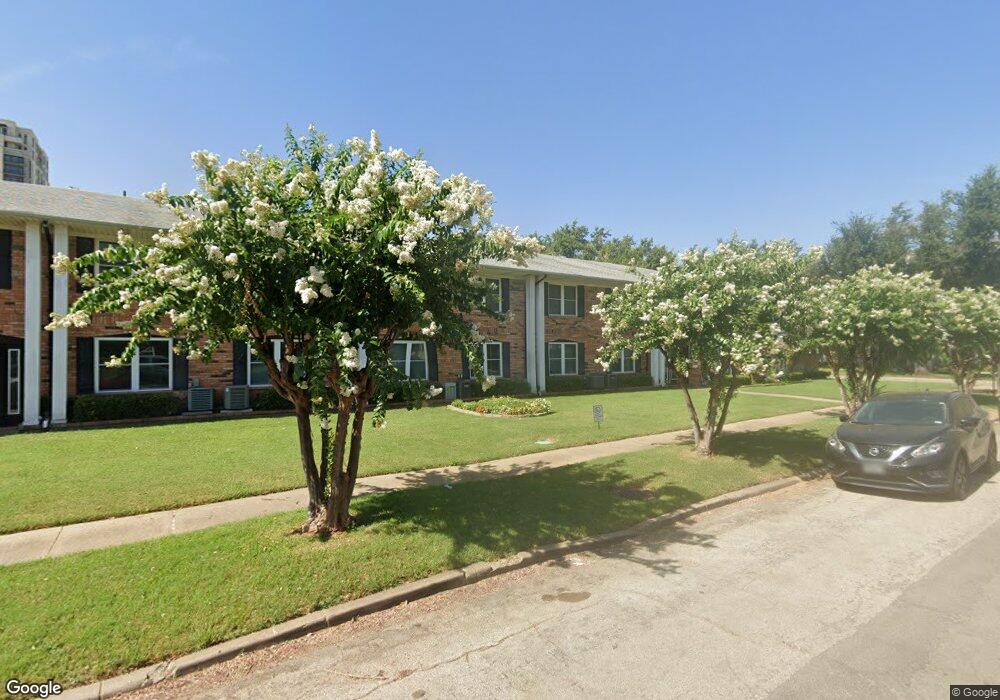
4206 Newton Ave Unit 108 Dallas, TX 75219
Oak Lawn NeighborhoodEstimated Value: $180,211 - $201,000
1
Bed
1
Bath
639
Sq Ft
$301/Sq Ft
Est. Value
About This Home
This home is located at 4206 Newton Ave Unit 108, Dallas, TX 75219 and is currently estimated at $192,553, approximately $301 per square foot. 4206 Newton Ave Unit 108 is a home located in Dallas County with nearby schools including Ben Milam Elementary School, Alex W. Spence Talented/Gifted Academy, and North Dallas High School.
Ownership History
Date
Name
Owned For
Owner Type
Purchase Details
Closed on
Jul 18, 2017
Sold by
Thibodeaux Kevin K and Kinslow Catherine K
Bought by
Ashdown Holdings Llc
Current Estimated Value
Purchase Details
Closed on
Aug 19, 2005
Sold by
Oak Park Properties Llc
Bought by
Afghani Kevin
Home Financials for this Owner
Home Financials are based on the most recent Mortgage that was taken out on this home.
Original Mortgage
$52,200
Interest Rate
5.61%
Mortgage Type
Fannie Mae Freddie Mac
Purchase Details
Closed on
Mar 11, 1998
Sold by
Mccowie Peggy H
Bought by
Ledford Linda F
Home Financials for this Owner
Home Financials are based on the most recent Mortgage that was taken out on this home.
Original Mortgage
$33,250
Interest Rate
7.13%
Mortgage Type
Purchase Money Mortgage
Create a Home Valuation Report for This Property
The Home Valuation Report is an in-depth analysis detailing your home's value as well as a comparison with similar homes in the area
Home Values in the Area
Average Home Value in this Area
Purchase History
| Date | Buyer | Sale Price | Title Company |
|---|---|---|---|
| Ashdown Holdings Llc | -- | None Available | |
| Afghani Kevin | -- | Ctic | |
| Ledford Linda F | -- | -- |
Source: Public Records
Mortgage History
| Date | Status | Borrower | Loan Amount |
|---|---|---|---|
| Previous Owner | Afghani Kevin | $52,200 | |
| Previous Owner | Ledford Linda F | $33,250 |
Source: Public Records
Tax History Compared to Growth
Tax History
| Year | Tax Paid | Tax Assessment Tax Assessment Total Assessment is a certain percentage of the fair market value that is determined by local assessors to be the total taxable value of land and additions on the property. | Land | Improvement |
|---|---|---|---|---|
| 2025 | $3,969 | $180,640 | $99,290 | $81,350 |
| 2024 | $3,969 | $180,640 | $99,290 | $81,350 |
| 2023 | $3,969 | $147,980 | $99,290 | $48,690 |
| 2022 | $3,314 | $146,970 | $0 | $0 |
| 2021 | $2,444 | $92,660 | $55,160 | $37,500 |
| 2020 | $2,514 | $92,660 | $55,160 | $37,500 |
| 2019 | $2,636 | $92,660 | $55,160 | $37,500 |
| 2018 | $2,636 | $92,660 | $55,160 | $37,500 |
| 2017 | $2,520 | $92,660 | $55,160 | $37,500 |
| 2016 | $1,901 | $69,900 | $55,160 | $14,740 |
| 2015 | $1,431 | $69,900 | $55,160 | $14,740 |
| 2014 | $1,431 | $69,900 | $55,160 | $14,740 |
Source: Public Records
Map
Nearby Homes
- 4215 Avondale Ave Unit 210D
- 4207 Avondale Ave Unit 106A
- 4206 Newton Ave Unit 115
- 4122 Avondale Ave Unit 204
- 3815 Throckmorton St
- 4130 Newton Ave Unit A
- 4021 Gilbert Ave Unit 6
- 4111 Newton Ave Unit 2
- 3919 Gilbert Ave Unit A
- 4040 Avondale Ave Unit 107A
- 4020 Holland Ave Unit 213
- 4020 Holland Ave Unit 202
- 4008 Holland Ave Unit A
- 4006 Holland Ave Unit B
- 3926 Holland Ave Unit 102
- 4123 Wycliff Ave
- 3818 Holland Ave Unit 309
- 3818 Holland Ave Unit 206
- 4139 Herschel Ave
- 3624 Douglas Ave
- 4206 Newton Ave Unit 105B
- 4206 Newton Ave Unit 203A
- 4206 Newton Ave Unit 104B
- 4206 Newton Ave Unit 101A
- 4206C Newton Ave Unit 111
- 4206C Newton Ave Unit 108
- 4206C Newton Ave Unit 109
- 4206 Newton Ave Unit 206C
- 4206C Newton Ave Unit 208
- 4206 Newton Ave Unit 205B
- 4206 Newton Ave Unit 204B
- 4206C Newton Ave Unit 209
- 4206 Newton Ave Unit 207C
- 4206 Newton Ave Unit 107C
- 4206 Newton Ave Unit 106C
- 4206 Newton Ave Unit 202A
- 4206 Newton Ave Unit 102A
- 4206 Newton Ave Unit 208
- 4206 Newton Ave Unit 103
- 4206 Newton Ave