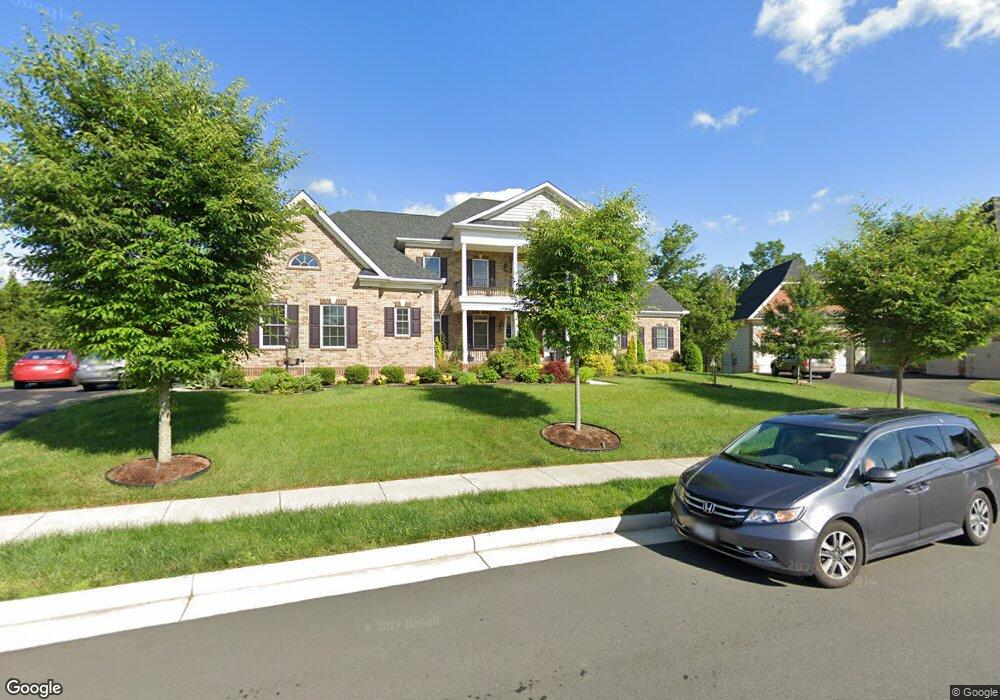
42067 Barrymoore Place Chantilly, VA 20152
Estimated Value: $1,757,668 - $1,943,000
5
Beds
8
Baths
5,843
Sq Ft
$321/Sq Ft
Est. Value
About This Home
This home is located at 42067 Barrymoore Place, Chantilly, VA 20152 and is currently estimated at $1,878,417, approximately $321 per square foot. 42067 Barrymoore Place is a home located in Loudoun County with nearby schools including Buffalo Trail Elementary School, Willard Middle School, and Lightridge High School.
Ownership History
Date
Name
Owned For
Owner Type
Purchase Details
Closed on
Nov 5, 2016
Sold by
Gannavaram Naga Sivaram
Bought by
Gannavaram Naga Sivaram and Gannavaram Bhramari
Current Estimated Value
Home Financials for this Owner
Home Financials are based on the most recent Mortgage that was taken out on this home.
Original Mortgage
$813,540
Outstanding Balance
$653,031
Interest Rate
3.5%
Mortgage Type
New Conventional
Estimated Equity
$1,225,386
Purchase Details
Closed on
Oct 20, 2016
Sold by
Nvr Inc A Virginia Corporation
Bought by
Gannavaram Naga Sivaram
Home Financials for this Owner
Home Financials are based on the most recent Mortgage that was taken out on this home.
Original Mortgage
$813,540
Outstanding Balance
$653,031
Interest Rate
3.5%
Mortgage Type
New Conventional
Estimated Equity
$1,225,386
Purchase Details
Closed on
May 5, 2016
Sold by
Allied & Marbury Llc A Virginia Limited Li
Bought by
Nvr Inc A Virginia Corporation
Create a Home Valuation Report for This Property
The Home Valuation Report is an in-depth analysis detailing your home's value as well as a comparison with similar homes in the area
Home Values in the Area
Average Home Value in this Area
Purchase History
| Date | Buyer | Sale Price | Title Company |
|---|---|---|---|
| Gannavaram Naga Sivaram | -- | None Available | |
| Gannavaram Naga Sivaram | $1,084,721 | Atd Title Llc | |
| Nvr Inc A Virginia Corporation | $1,448,130 | Nvr Settlement Services Inc |
Source: Public Records
Mortgage History
| Date | Status | Borrower | Loan Amount |
|---|---|---|---|
| Open | Gannavaram Naga Sivaram | $813,540 |
Source: Public Records
Tax History Compared to Growth
Tax History
| Year | Tax Paid | Tax Assessment Tax Assessment Total Assessment is a certain percentage of the fair market value that is determined by local assessors to be the total taxable value of land and additions on the property. | Land | Improvement |
|---|---|---|---|---|
| 2025 | $14,304 | $1,776,920 | $385,800 | $1,391,120 |
| 2024 | $13,760 | $1,590,730 | $385,800 | $1,204,930 |
| 2023 | $12,960 | $1,481,170 | $385,800 | $1,095,370 |
| 2022 | $12,168 | $1,367,200 | $305,800 | $1,061,400 |
| 2021 | $10,961 | $1,118,430 | $270,800 | $847,630 |
| 2020 | $11,195 | $1,081,620 | $250,800 | $830,820 |
| 2019 | $10,775 | $1,031,100 | $250,800 | $780,300 |
| 2018 | $11,200 | $1,032,230 | $240,800 | $791,430 |
| 2017 | $11,744 | $1,043,880 | $240,800 | $803,080 |
| 2016 | $2,700 | $235,800 | $0 | $0 |
Source: Public Records
Map
Nearby Homes
- 0 Marbury Estates Dr Unit VALO2095034
- 26065 Huntwick Glen Square
- 42549 Fawn Meadow Place
- 41880 Hayfield Orchard Way
- 42115 Piebald Square
- 42804 Appaloosa Trail Ct
- 41854 Juniper Hill Ct
- 25771 Double Bridle Terrace
- 42474 Iron Bit Place
- 25705 Clairmont Manor Square
- 0 Braddock Rd Unit VALO2086014
- 25685 Arborshade Pass Place
- 42294 Iron Bit Place
- 0 Ambrose Tree Place
- Sullivan 31-F2 Plan at South 620 - Single Family Home
- Vesper 34-F2 Plan at South 620 - Villa
- Vida 34-F2 Plan at South 620 - Villa
- 25648 Red Cherry Dr
- 27586 Paddock Trail Place
- 25636 Red Cherry Dr
- 42063 Barrymoore Place
- 42071 Barrymoore Place
- 42066 Barrymoore Place
- 42075 Barrymoore Place
- 42070 Barrymoore Place
- 42059 Barrymoore Place
- 42058 Barrymoore Place
- 42079 Barrymoore Place
- 26675 Tebbs Farm Way
- 42078 Barrymoore Place
- 26679 Tebbs Farm Way
- 42051 Barrymoore Place
- 42086 Barrymoore Place
- 42087 Barrymoore Place
- 42046 Barrymoore Place
- 26678 Tebbs Farm Way
- 26687 Tebbs Farm Way
- 26685 Marbury Estates Dr
- 42047 Barrymoore Place
- 42042 Barrymoore Place