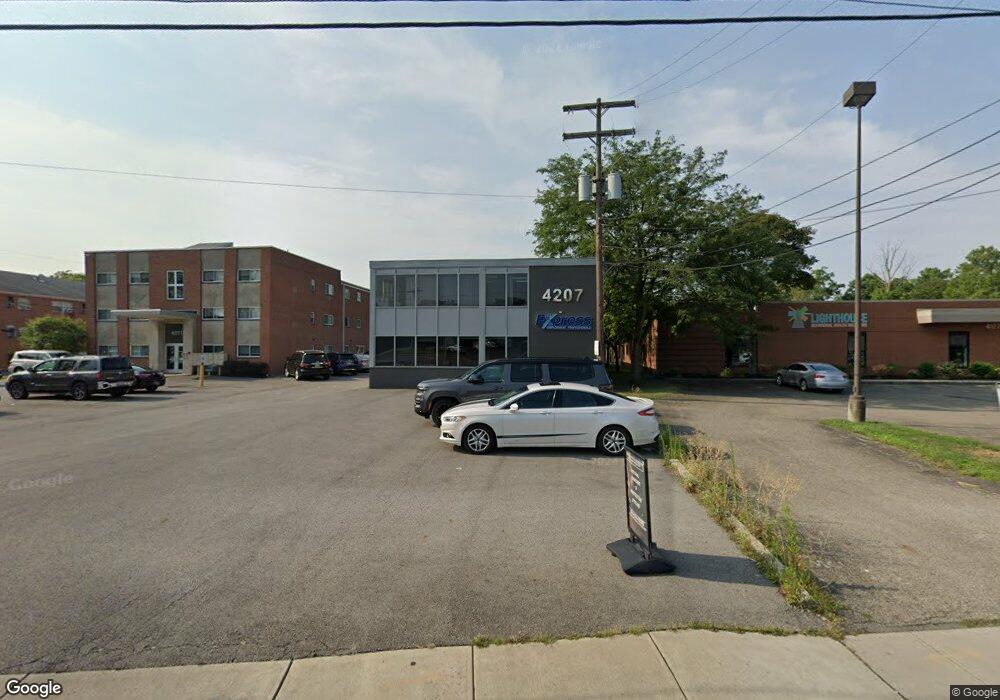
4207 E Broad St Columbus, OH 43213
Estimated Value: $558,225
Studio
--
Bath
7,728
Sq Ft
$72/Sq Ft
Est. Value
About This Home
This home is located at 4207 E Broad St, Columbus, OH 43213 and is currently estimated at $558,225, approximately $72 per square foot. 4207 E Broad St is a home located in Franklin County with nearby schools including Beechwood Elementary School, Etna Road Elementary School, and Rosemore Middle School.
Ownership History
Date
Name
Owned For
Owner Type
Purchase Details
Closed on
Nov 8, 2017
Sold by
Levitskiy Grigoriy
Bought by
4207 Properties Llc
Current Estimated Value
Purchase Details
Closed on
Jan 16, 2017
Sold by
Shffer Family Properties Llc
Bought by
Levitskiy Grigoriy
Purchase Details
Closed on
Dec 28, 2007
Sold by
Community Housing Network Inc
Bought by
Shaffer Family Properties Llc
Home Financials for this Owner
Home Financials are based on the most recent Mortgage that was taken out on this home.
Original Mortgage
$175,000
Interest Rate
6.13%
Mortgage Type
Commercial
Purchase Details
Closed on
Jun 26, 2007
Sold by
Jb 4207-11 Llc
Bought by
Community Housing Network Inc
Purchase Details
Closed on
Dec 30, 1986
Bought by
Bloom Jack
Create a Home Valuation Report for This Property
The Home Valuation Report is an in-depth analysis detailing your home's value as well as a comparison with similar homes in the area
Home Values in the Area
Average Home Value in this Area
Purchase History
| Date | Buyer | Sale Price | Title Company |
|---|---|---|---|
| 4207 Properties Llc | -- | None Available | |
| Levitskiy Grigoriy | $182,000 | None Available | |
| Shaffer Family Properties Llc | $250,000 | Title Co Lt | |
| Community Housing Network Inc | $1,125,000 | Title Co Lt | |
| Bloom Jack | -- | -- |
Source: Public Records
Mortgage History
| Date | Status | Borrower | Loan Amount |
|---|---|---|---|
| Previous Owner | Shaffer Family Properties Llc | $175,000 |
Source: Public Records
Tax History
| Year | Tax Paid | Tax Assessment Tax Assessment Total Assessment is a certain percentage of the fair market value that is determined by local assessors to be the total taxable value of land and additions on the property. | Land | Improvement |
|---|---|---|---|---|
| 2025 | $7,544 | $99,830 | $36,860 | $62,970 |
| 2024 | $7,544 | $99,830 | $36,860 | $62,970 |
| 2023 | $7,480 | $99,820 | $36,855 | $62,965 |
| 2022 | $5,991 | $73,230 | $23,880 | $49,350 |
| 2021 | $5,737 | $73,230 | $23,880 | $49,350 |
| 2020 | $5,671 | $73,230 | $23,880 | $49,350 |
| 2019 | $5,422 | $66,580 | $21,710 | $44,870 |
| 2018 | $6,397 | $66,580 | $21,710 | $44,870 |
| 2017 | $5,288 | $66,580 | $21,710 | $44,870 |
| 2016 | $7,246 | $87,520 | $21,710 | $65,810 |
| 2015 | $7,309 | $87,520 | $21,710 | $65,810 |
| 2014 | $7,310 | $87,520 | $21,710 | $65,810 |
| 2013 | $3,114 | $75,250 | $18,515 | $56,735 |
Source: Public Records
Map
Nearby Homes
- 225 Santa Maria Ln
- 4148 Elbern Ave
- 3857 Doney St
- 4117 Elbern Ave
- 4517 Saint Rita Ln
- 3840 Elbern Ave
- 3814 Elbern Ave
- 320 Collingwood Ave
- 491 Westphal Ave
- 68 S Weyant Ave
- 413 Shell Ct E Unit K413
- 695 Erickson Ave
- 181 S Weyant Ave
- 34 N Hampton Rd
- 50 N Hampton Rd
- 4174 Wright Park
- 73 N Hampton Rd
- 746 S Yearling Rd
- 39 N Hampton Rd
- 269 S Weyant Ave
- 4194 E Broad St
- 4221 E Broad St
- 4129 Abbey Ct Unit 131
- 4121 Abbey Ct Unit 123
- 4222 E Broad St
- 4202 E Broad St
- 4204 E Broad St
- 4113 Abbey Ct Unit 117
- 4113-4117 Abbey Ct
- 60 Beechcreek Rd Unit 62
- 4236 E Broad St
- 46-52 Beechford Rd
- 66 Beechford Rd Unit 68
- 4079 Abbey Ct Unit 81
- 4264 E Broad St
- 4264 E Broad St
- 114 Beechbank Rd Unit 116
- 118 Beechbank Rd Unit 120
- 110 Beechbank Rd Unit 112
- 4069 Abbey Ct Unit 71
Your Personal Tour Guide
Ask me questions while you tour the home.