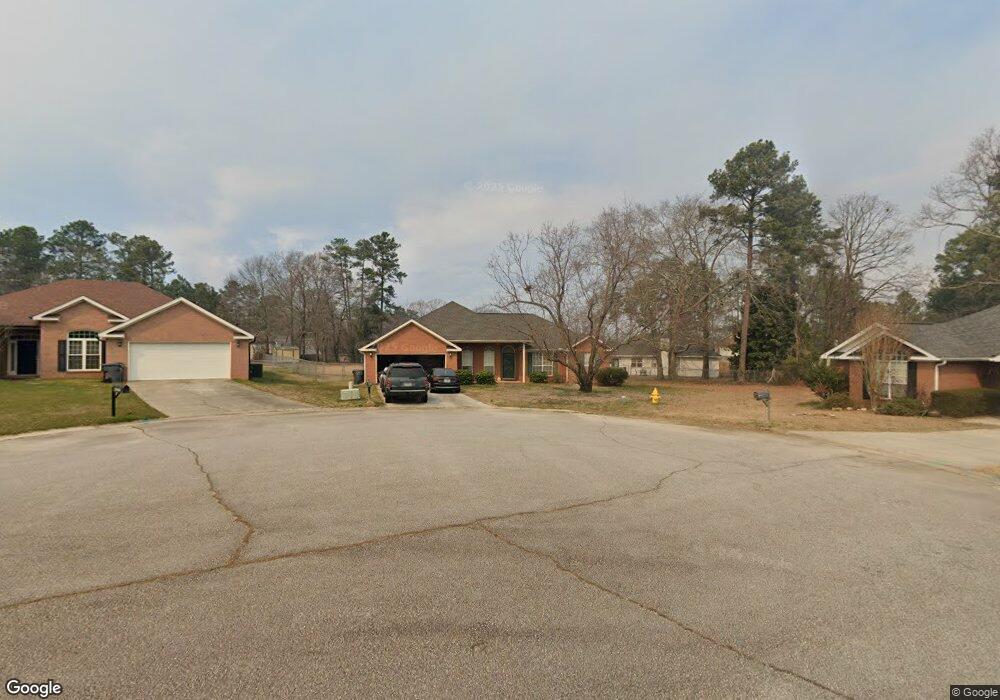
4207 Hyannis Ct Grovetown, GA 30813
Estimated Value: $273,000 - $280,000
4
Beds
2
Baths
2,057
Sq Ft
$134/Sq Ft
Est. Value
About This Home
This home is located at 4207 Hyannis Ct, Grovetown, GA 30813 and is currently estimated at $275,846, approximately $134 per square foot. 4207 Hyannis Ct is a home located in Columbia County with nearby schools including Grovetown Elementary School, Grovetown Middle School, and Grovetown High School.
Create a Home Valuation Report for This Property
The Home Valuation Report is an in-depth analysis detailing your home's value as well as a comparison with similar homes in the area
Home Values in the Area
Average Home Value in this Area
Tax History Compared to Growth
Tax History
| Year | Tax Paid | Tax Assessment Tax Assessment Total Assessment is a certain percentage of the fair market value that is determined by local assessors to be the total taxable value of land and additions on the property. | Land | Improvement |
|---|---|---|---|---|
| 2025 | $2,222 | $109,453 | $21,304 | $88,149 |
| 2024 | $2,303 | $108,175 | $17,704 | $90,471 |
| 2023 | $1,397 | $93,739 | $17,104 | $76,635 |
| 2022 | $1,781 | $87,939 | $17,604 | $70,335 |
| 2021 | $1,512 | $77,516 | $16,004 | $61,512 |
| 2020 | $1,363 | $72,302 | $14,104 | $58,198 |
| 2019 | $1,150 | $65,242 | $13,204 | $52,038 |
| 2018 | $1,242 | $67,446 | $12,604 | $54,842 |
| 2017 | $2,164 | $66,384 | $12,804 | $53,580 |
| 2016 | $1,980 | $62,350 | $11,780 | $50,570 |
| 2015 | $1,908 | $59,806 | $11,180 | $48,626 |
| 2014 | $1,809 | $56,094 | $10,780 | $45,314 |
Source: Public Records
Map
Nearby Homes
- 4907 Selkirk Way
- 1100 Durban Dr
- 0 E Robinson Ave
- 636 Butler Springs Cir
- 132 Summerfield Cir
- 4917 Cavan Place
- 125 Redford Dr
- 824 Shirez Dr
- 100 Buck Ave
- 427 Roebuck Pass
- 607 Beretta Dr
- 1399 Admiral Ave
- 1352 Admiral Ave
- 1392 Admiral Ave
- 1384 Admiral Ave Unit 117
- 1348 Admiral Ave
- 1380 Admiral Ave Unit 116
- 1388 Admiral Ave
- 1344 Admiral Ave
- 1380 Admiral Ave
- 4205 Hyannis Ct
- 4897 Selkirk Way
- 4208 Hyannis Ct
- 4899 Selkirk Way
- 4203 Hyannis Ct
- 4895 Selkirk Way
- 4100 Nantucket Cir
- 4206 Hyannis Ct
- 4201 Hyannis Ct
- 4204 Hyannis Ct
- 4903 Selkirk Way
- 4102 Nantucket Cir
- 4305 Felmellow Dr
- 1023 Jarrow Place
- 4202 Hyannis Ct
- 4307 Felmellow Dr
- 4613 Marthas Way
- 4896 Selkirk Way
- 4200 Hyannis Ct
- 4900 Selkirk Way