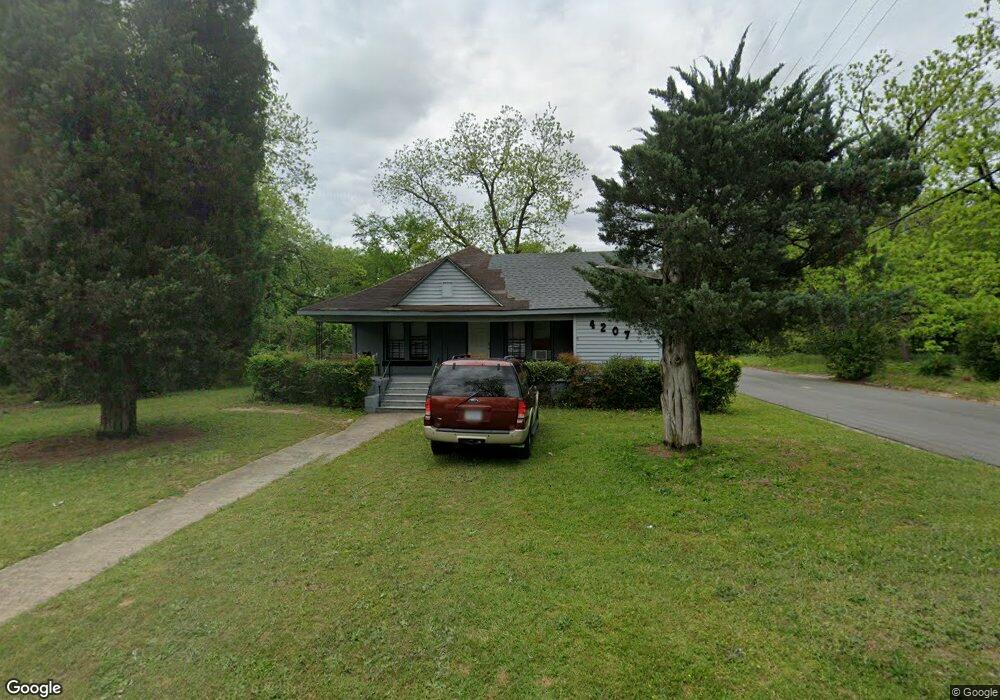
4207 Mikado Ave Macon, GA 31206
Estimated Value: $56,000 - $80,000
2
Beds
2
Baths
1,596
Sq Ft
$45/Sq Ft
Est. Value
About This Home
This home is located at 4207 Mikado Ave, Macon, GA 31206 and is currently estimated at $71,519, approximately $44 per square foot. 4207 Mikado Ave is a home located in Bibb County with nearby schools including Bruce Elementary School, Rutland Middle School, and Rutland High School.
Ownership History
Date
Name
Owned For
Owner Type
Purchase Details
Closed on
Jan 15, 2016
Sold by
Winhard Properties Llc
Bought by
Rutherford Devon
Current Estimated Value
Purchase Details
Closed on
Jan 8, 2016
Sold by
Crist Investments Llc
Bought by
Winhard Properties Llc
Purchase Details
Closed on
Sep 18, 2012
Sold by
Thor Real Estate Llc
Bought by
Crist Investments Llc
Purchase Details
Closed on
Oct 8, 2008
Sold by
Blue Spruce Entities Llc
Bought by
Thor Real Estate Llc
Purchase Details
Closed on
Oct 7, 2008
Sold by
Us Bank National Association
Bought by
Blue Spruce Entities Llc
Purchase Details
Closed on
Mar 4, 2008
Sold by
Nixon Kenneth E and Nixon Joy B
Bought by
Us Bank Na
Purchase Details
Closed on
Nov 8, 2004
Bought by
Nixon Kenneth E and Nixon Joy B
Purchase Details
Closed on
Mar 19, 2004
Purchase Details
Closed on
Aug 25, 2003
Purchase Details
Closed on
Nov 5, 2002
Purchase Details
Closed on
Aug 17, 2001
Create a Home Valuation Report for This Property
The Home Valuation Report is an in-depth analysis detailing your home's value as well as a comparison with similar homes in the area
Purchase History
| Date | Buyer | Sale Price | Title Company |
|---|---|---|---|
| Rutherford Devon | $4,000 | -- | |
| Winhard Properties Llc | $2,000 | -- | |
| Crist Investments Llc | $6,220 | None Available | |
| Thor Real Estate Llc | $4,500 | None Available | |
| Blue Spruce Entities Llc | $3,500 | None Available | |
| Us Bank Na | $28,000 | None Available | |
| Nixon Kenneth E | -- | -- | |
| -- | $67,000 | -- | |
| -- | $27,500 | -- | |
| -- | $55,800 | -- | |
| -- | $35,000 | -- |
Source: Public Records
Tax History
| Year | Tax Paid | Tax Assessment Tax Assessment Total Assessment is a certain percentage of the fair market value that is determined by local assessors to be the total taxable value of land and additions on the property. | Land | Improvement |
|---|---|---|---|---|
| 2025 | $456 | $18,541 | $2,200 | $16,341 |
| 2024 | $449 | $17,681 | $2,200 | $15,481 |
| 2023 | $524 | $17,681 | $2,200 | $15,481 |
| 2022 | $388 | $11,202 | $1,363 | $9,839 |
| 2021 | $248 | $6,514 | $1,226 | $5,288 |
| 2020 | $215 | $5,531 | $1,226 | $4,305 |
| 2019 | $217 | $5,531 | $1,226 | $4,305 |
| 2018 | $458 | $4,644 | $954 | $3,690 |
| 2017 | $60 | $4,644 | $954 | $3,690 |
| 2016 | $182 | $5,259 | $954 | $4,305 |
| 2015 | $258 | $5,259 | $954 | $4,305 |
| 2014 | $159 | $8,470 | $1,090 | $7,380 |
Source: Public Records
Map
Nearby Homes
- 4195 Mikado Ave
- 4235 Mikado Ave
- 925 Troupe St
- 4209 Capitol Ave
- 823 Fulton St
- 4067 Mikado Ave
- 4255 Worsham Ave
- 1216 Buena Vista Ave
- 4023 Cynthia Weir Place
- 1094 Triple Hill Dr
- 4319 Worsham Ave
- 4378 Mikado Ave
- 4054 Marion Ave
- 4301 Marion Ave
- 1156 Triple Hill Dr
- 4385 Mikado Ave
- 4189 Marion Ave
- 4305 Marion Ave
- 4386 Mikado Ave
- 4268 Marion Ave
- 4227 Mikado Ave
- 956 Charlotte St
- 4189 Mikado Ave
- 4208 Mikado Ave
- 970 Charlotte St
- 947 Charlotte St
- 4196 Mikado Ave
- 4226 Mikado Ave
- 4171 Mikado Ave
- 4188 Mikado Ave
- 965 Charlotte St
- 982 Charlotte St
- 4234 Mikado Ave
- 4180 Mikado Ave
- 947 Burke St
- 983 Charlotte St
- 983 Charlotte St Unit 8
- 4172 Mikado Ave
- 994 Charlotte St
- 872 Charlotte St
Your Personal Tour Guide
Ask me questions while you tour the home.