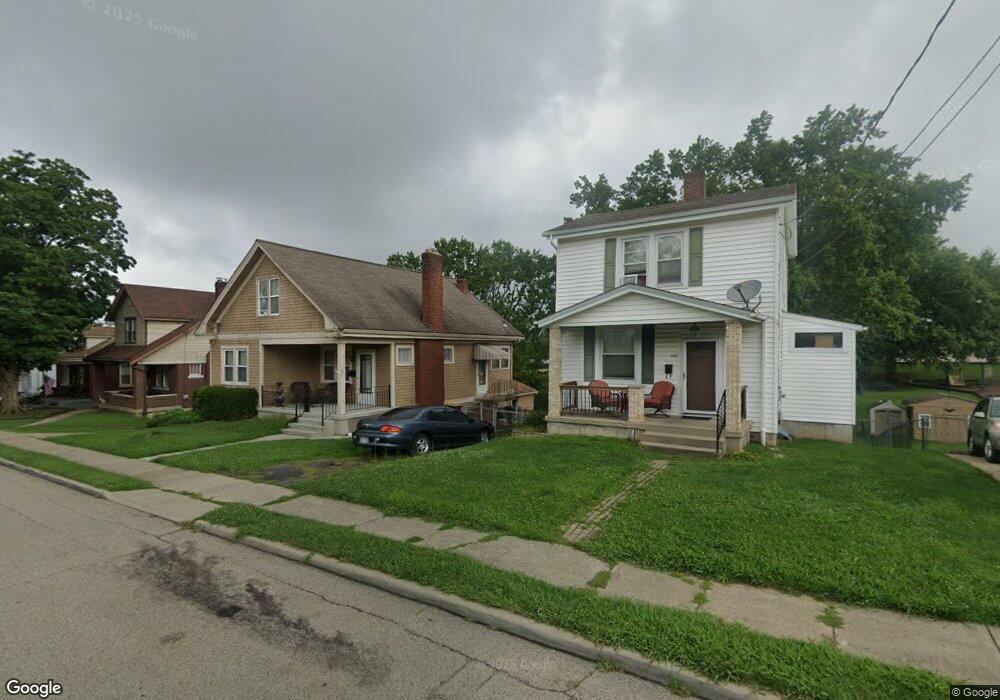
4208 Harding Ave Cincinnati, OH 45211
Estimated Value: $164,000 - $180,925
3
Beds
2
Baths
968
Sq Ft
$177/Sq Ft
Est. Value
About This Home
This home is located at 4208 Harding Ave, Cincinnati, OH 45211 and is currently estimated at $171,731, approximately $177 per square foot. 4208 Harding Ave is a home located in Hamilton County with nearby schools including Cheviot Elementary School, Western Hills High School, and Gilbert A. Dater High School.
Ownership History
Date
Name
Owned For
Owner Type
Purchase Details
Closed on
Jun 11, 2012
Sold by
Kendrick Barbara A and Terry John T
Bought by
Kendrick Barbara A
Current Estimated Value
Purchase Details
Closed on
Apr 4, 2007
Sold by
Deveau Jennifer
Bought by
Kendrick Barbara A and Terry John T
Home Financials for this Owner
Home Financials are based on the most recent Mortgage that was taken out on this home.
Original Mortgage
$92,500
Outstanding Balance
$54,935
Interest Rate
6.19%
Mortgage Type
Unknown
Estimated Equity
$116,796
Purchase Details
Closed on
Nov 14, 2003
Sold by
Pichichero James J and Pichichero Melissa M
Bought by
Deveau Jennifer
Home Financials for this Owner
Home Financials are based on the most recent Mortgage that was taken out on this home.
Original Mortgage
$115,500
Interest Rate
5.75%
Mortgage Type
Unknown
Create a Home Valuation Report for This Property
The Home Valuation Report is an in-depth analysis detailing your home's value as well as a comparison with similar homes in the area
Home Values in the Area
Average Home Value in this Area
Purchase History
| Date | Buyer | Sale Price | Title Company |
|---|---|---|---|
| Kendrick Barbara A | -- | Attorney | |
| Kendrick Barbara A | $92,500 | Landamerica | |
| Deveau Jennifer | $115,500 | -- |
Source: Public Records
Mortgage History
| Date | Status | Borrower | Loan Amount |
|---|---|---|---|
| Open | Kendrick Barbara A | $92,500 | |
| Previous Owner | Deveau Jennifer | $115,500 |
Source: Public Records
Tax History
| Year | Tax Paid | Tax Assessment Tax Assessment Total Assessment is a certain percentage of the fair market value that is determined by local assessors to be the total taxable value of land and additions on the property. | Land | Improvement |
|---|---|---|---|---|
| 2025 | $2,919 | $46,785 | $8,068 | $38,717 |
| 2023 | $2,896 | $46,785 | $8,068 | $38,717 |
| 2022 | $2,602 | $36,393 | $7,630 | $28,763 |
| 2021 | $2,539 | $36,393 | $7,630 | $28,763 |
| 2020 | $2,574 | $36,393 | $7,630 | $28,763 |
| 2019 | $2,535 | $32,208 | $6,752 | $25,456 |
| 2018 | $2,538 | $32,208 | $6,752 | $25,456 |
| 2017 | $2,428 | $32,208 | $6,752 | $25,456 |
| 2016 | $2,554 | $33,247 | $7,039 | $26,208 |
| 2015 | $2,319 | $33,247 | $7,039 | $26,208 |
| 2014 | $2,266 | $33,247 | $7,039 | $26,208 |
| 2013 | $2,420 | $34,997 | $7,410 | $27,587 |
Source: Public Records
Map
Nearby Homes
- 3608 Robb Ave
- 3709 Frances Ave
- 3713 Frances Ave
- 3761 Wilmar Dr
- 3445 Robb Ave
- 4269 Grotto Ct
- 3432 Alta Vista Ave
- 4163 Harrison Ave
- 3727 Lovell Ave
- 3744 Dina Ave
- 5452 Karen Ave
- 3823 Applegate Ave
- 3743 Bank Ct
- 5517 Surrey Ave
- 3962 School Section Rd
- 5465 Childs Ave
- 3935 Lovell Ave
- 3936 Janett Ave
- 5549 Surrey Ave
- 3599 Schwartze Ave
- 4210 Harding Ave
- 4206 Harding Ave
- 4212 Harding Ave
- 4204 Harding Ave
- 4214 Harding Ave
- 4202 Harding Ave
- 4216 Harding Ave
- 4209 Harding Ave
- 4205 Harding Ave
- 4203 Harding Ave
- 4211 Harding Ave
- 4218 Harding Ave
- 3703 Robb Ave
- 4215 Harding Ave
- 3705 Robb Ave
- 4201 Harding Ave
- 4200 Harding Ave
- 4217 Harding Ave
- 4220 Harding Ave
- 4219 Harding Ave
Your Personal Tour Guide
Ask me questions while you tour the home.