Estimated Value: $271,000 - $349,000
3
Beds
1
Bath
1,008
Sq Ft
$306/Sq Ft
Est. Value
About This Home
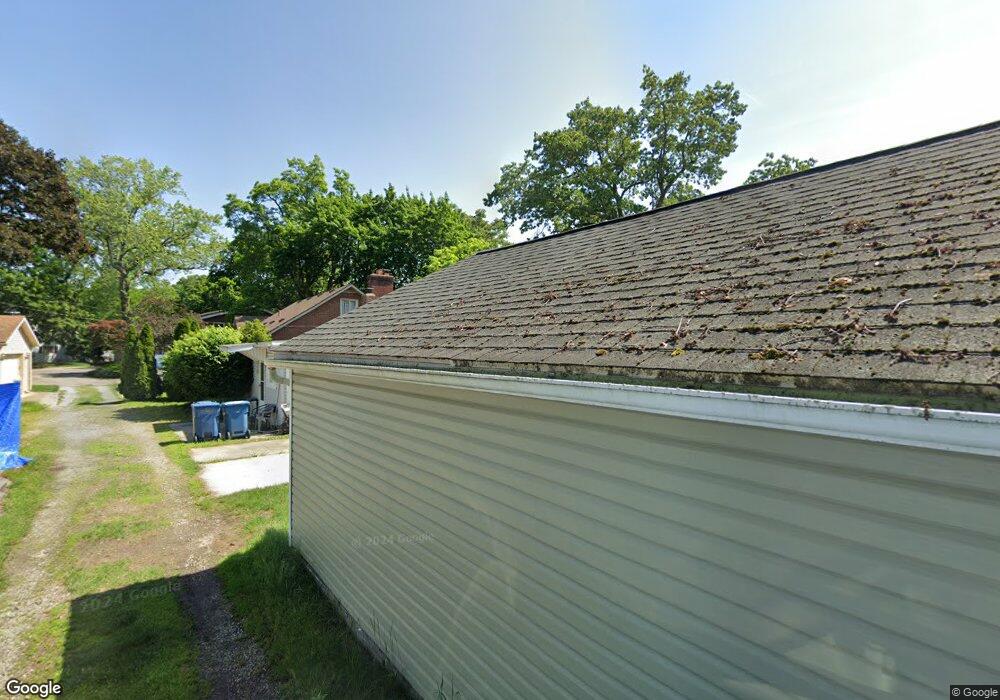
This home is located at 4208 Hunsicker Dr, Akron, OH 44319 and is currently estimated at $308,247, approximately $305 per square foot. 4208 Hunsicker Dr is a home located in Summit County with nearby schools including Coventry Middle School, Coventry High School, and St. Francis de Sales School.
Ownership History
Date
Name
Owned For
Owner Type
Purchase Details
Closed on
May 8, 2014
Sold by
Meghen Jeffrey R
Bought by
Meighen Jeffrey R and Meighen Jessica E
Current Estimated Value
Purchase Details
Closed on
Jul 11, 2008
Sold by
Henry Cynthia S
Bought by
Meighen Jeffrey R
Home Financials for this Owner
Home Financials are based on the most recent Mortgage that was taken out on this home.
Original Mortgage
$142,200
Outstanding Balance
$94,846
Interest Rate
6.75%
Mortgage Type
Purchase Money Mortgage
Estimated Equity
$213,401
Purchase Details
Closed on
Jun 9, 2008
Sold by
Estate Of William L Henry
Bought by
Henry Cynthia S
Home Financials for this Owner
Home Financials are based on the most recent Mortgage that was taken out on this home.
Original Mortgage
$142,200
Outstanding Balance
$94,846
Interest Rate
6.75%
Mortgage Type
Purchase Money Mortgage
Estimated Equity
$213,401
Create a Home Valuation Report for This Property
The Home Valuation Report is an in-depth analysis detailing your home's value as well as a comparison with similar homes in the area
Home Values in the Area
Average Home Value in this Area
Purchase History
| Date | Buyer | Sale Price | Title Company |
|---|---|---|---|
| Meighen Jeffrey R | -- | None Available | |
| Meighen Jeffrey R | $158,000 | Bond & Associates Title Agen | |
| Henry Cynthia S | -- | None Available |
Source: Public Records
Mortgage History
| Date | Status | Borrower | Loan Amount |
|---|---|---|---|
| Open | Meighen Jeffrey R | $142,200 |
Source: Public Records
Tax History Compared to Growth
Tax History
| Year | Tax Paid | Tax Assessment Tax Assessment Total Assessment is a certain percentage of the fair market value that is determined by local assessors to be the total taxable value of land and additions on the property. | Land | Improvement |
|---|---|---|---|---|
| 2025 | $5,208 | $104,832 | $41,615 | $63,217 |
| 2024 | $5,208 | $104,832 | $41,615 | $63,217 |
| 2023 | $5,208 | $104,832 | $41,615 | $63,217 |
| 2022 | $4,119 | $70,819 | $27,930 | $42,889 |
| 2021 | $4,124 | $70,819 | $27,930 | $42,889 |
| 2020 | $4,005 | $70,820 | $27,930 | $42,890 |
| 2019 | $3,908 | $63,660 | $27,760 | $35,900 |
| 2018 | $3,865 | $63,660 | $27,760 | $35,900 |
| 2017 | $3,753 | $63,660 | $27,760 | $35,900 |
| 2016 | $3,700 | $56,790 | $27,760 | $29,030 |
| 2015 | $3,753 | $56,790 | $27,760 | $29,030 |
| 2014 | $3,762 | $56,790 | $27,760 | $29,030 |
| 2013 | $3,462 | $53,090 | $27,760 | $25,330 |
Source: Public Records
Map
Nearby Homes
- 4131 State Park Dr
- 547 Kruger Ave
- 3834 N Glenridge Rd
- 3798 N Glenridge Rd
- 196 Lake Front Dr
- 3970 Melton Ave
- 3704 S Turkeyfoot Rd
- 369 E Pace Ave
- 229 Flynn Ave
- 232 Olden Ave
- 228 Olden Ave
- 222 Olden Ave
- 2 Starboard Cir Unit 77
- 265 E Pace Ave
- 68 Starboard Cir
- 0 W Turkeyfoot Lake Rd Unit 5157637
- 3807 Hummel Dr
- 63 Starboard Cir Unit 64
- 3870 S Main St
- 0 Sandy Beach Dr
- 4208 Hunsicker Dr
- 413 Kirk Ave
- 4200 Hunsicker Dr
- 408 Kirk Ave
- 417 Kirk Ave
- 4216 Hunsicker Dr
- 416 Kirk Ave
- 425 Kirk Ave
- 400 Hunsicker Dr
- 4230 Hunsicker Dr
- 4220 Hunsicker Dr
- 420 Kirk Ave
- 410 Hunsicker Dr
- 413 Bixler Ave
- 419 Bixler Ave
- 416 Hunsicker Dr
- 4184 Hunsicker Dr
- 427 Bixler Ave
- 4236 Hunsicker Dr
- 4028 Tarlton Ave