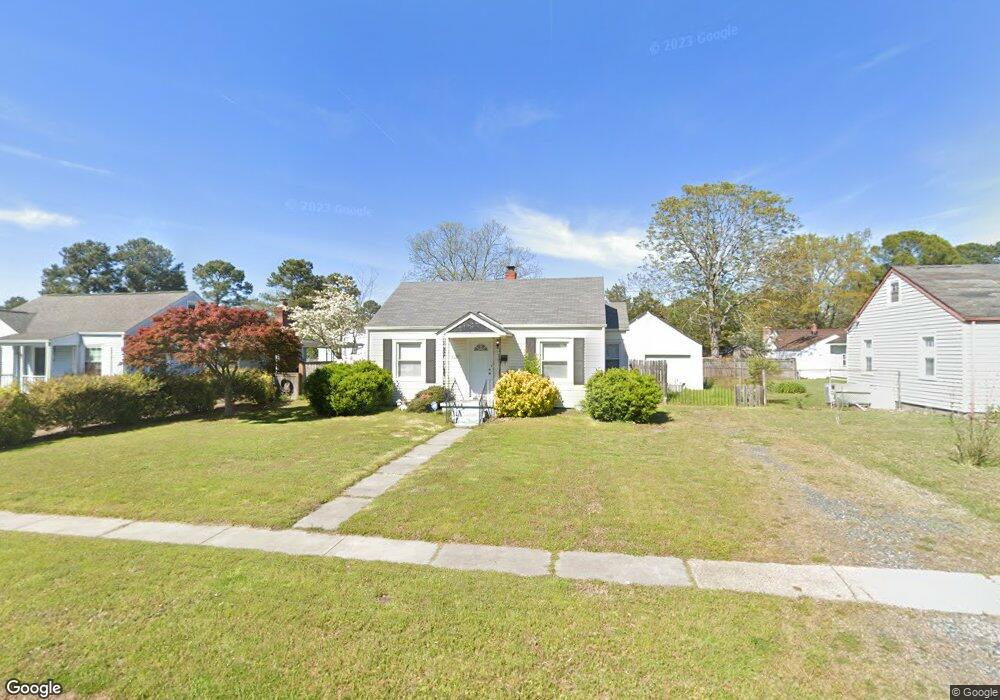
4208 Surf Ave Chesapeake, VA 23325
Indian River NeighborhoodEstimated Value: $264,000 - $287,891
2
Beds
1
Bath
815
Sq Ft
$335/Sq Ft
Est. Value
About This Home
This home is located at 4208 Surf Ave, Chesapeake, VA 23325 and is currently estimated at $273,223, approximately $335 per square foot. 4208 Surf Ave is a home located in Chesapeake City with nearby schools including Georgetown Primary School, Sparrow Road Intermediate School, and Indian River Middle.
Ownership History
Date
Name
Owned For
Owner Type
Purchase Details
Closed on
Feb 13, 2025
Sold by
Taylor Richard L and Taylor Jennifer L
Bought by
Newton Robert Kenian and Newton Robert Kenian
Current Estimated Value
Home Financials for this Owner
Home Financials are based on the most recent Mortgage that was taken out on this home.
Original Mortgage
$257,050
Outstanding Balance
$255,561
Interest Rate
7.04%
Mortgage Type
New Conventional
Estimated Equity
$17,662
Purchase Details
Closed on
Sep 5, 2024
Sold by
Fortis Christopher and Fortis Stephen
Bought by
Taylor Richard L and Taylor Jennifer L
Purchase Details
Closed on
Feb 10, 2015
Sold by
Equity Trustees Llc Sub Tr
Bought by
Cedar Homes Llc
Home Financials for this Owner
Home Financials are based on the most recent Mortgage that was taken out on this home.
Original Mortgage
$125,000
Interest Rate
3.9%
Mortgage Type
New Conventional
Purchase Details
Closed on
Jul 20, 2006
Sold by
Tatem Donna G
Bought by
Titan Capital Corp
Create a Home Valuation Report for This Property
The Home Valuation Report is an in-depth analysis detailing your home's value as well as a comparison with similar homes in the area
Home Values in the Area
Average Home Value in this Area
Purchase History
| Date | Buyer | Sale Price | Title Company |
|---|---|---|---|
| Newton Robert Kenian | $265,000 | Stewart Title Guaranty Company | |
| Taylor Richard L | $175,000 | Stewart Title | |
| Cedar Homes Llc | $81,100 | -- | |
| Titan Capital Corp | $98,000 | -- |
Source: Public Records
Mortgage History
| Date | Status | Borrower | Loan Amount |
|---|---|---|---|
| Open | Newton Robert Kenian | $257,050 | |
| Previous Owner | Cedar Homes Llc | $125,000 |
Source: Public Records
Tax History Compared to Growth
Tax History
| Year | Tax Paid | Tax Assessment Tax Assessment Total Assessment is a certain percentage of the fair market value that is determined by local assessors to be the total taxable value of land and additions on the property. | Land | Improvement |
|---|---|---|---|---|
| 2025 | $2,173 | $257,300 | $125,000 | $132,300 |
| 2024 | $2,173 | $215,100 | $115,000 | $100,100 |
| 2023 | $1,780 | $195,900 | $105,000 | $90,900 |
| 2022 | $1,770 | $175,200 | $95,000 | $80,200 |
| 2021 | $1,601 | $152,500 | $75,000 | $77,500 |
| 2020 | $1,505 | $143,300 | $75,000 | $68,300 |
| 2019 | $1,523 | $145,000 | $75,000 | $70,000 |
| 2018 | $1,412 | $135,500 | $75,000 | $60,500 |
| 2017 | $1,453 | $138,400 | $75,000 | $63,400 |
| 2016 | $1,453 | $138,400 | $75,000 | $63,400 |
| 2015 | $1,423 | $135,500 | $75,000 | $60,500 |
| 2014 | $1,423 | $135,500 | $75,000 | $60,500 |
Source: Public Records
Map
Nearby Homes
- 4215 Surf Ave
- 708 Sparrow Rd
- 1114 Willow Ave
- 817 Harway Ave
- 924 Trestman Ave
- 105 Lenwil Dr
- 1208 Willow Ave
- 3425 Glen Arden Rd
- 902 Laurel Ave
- 1128 Lilac Ave
- 1204 Myrtle Ave
- 1025 Sherry Ave
- 1208 Santeetlah Ave
- 1020 Emporia Ave
- 3396 Monticello Dr
- 3521 Riverstone Way
- 112 Bow St
- 3141 Manatee Dr
- 3532 Bow St
- 3124 Choctaw Dr