Estimated Value: $343,000 - $385,000
5
Beds
4
Baths
2,350
Sq Ft
$155/Sq Ft
Est. Value
About This Home
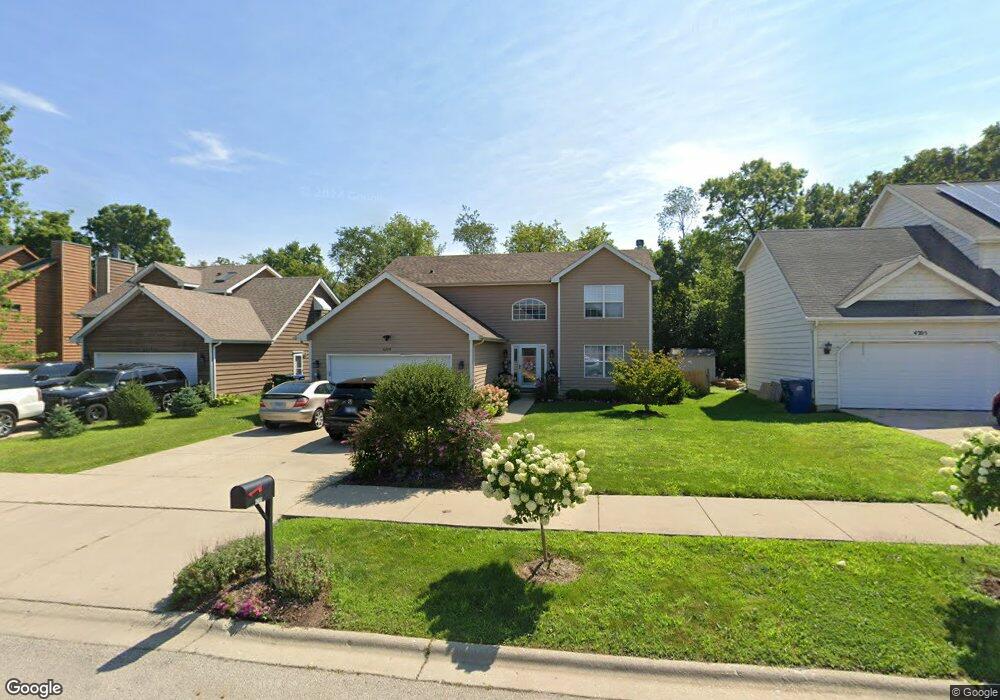
This home is located at 4209 Bertrand Ln, Zion, IL 60099 and is currently estimated at $364,378, approximately $155 per square foot. 4209 Bertrand Ln is a home located in Lake County with nearby schools including Oak Crest School, Beach Park Middle School, and Zion-Benton Township High School.
Ownership History
Date
Name
Owned For
Owner Type
Purchase Details
Closed on
Mar 7, 2017
Sold by
St Cloud Ventures Llc
Bought by
Borkes Bethany L
Current Estimated Value
Home Financials for this Owner
Home Financials are based on the most recent Mortgage that was taken out on this home.
Original Mortgage
$159,600
Outstanding Balance
$106,840
Interest Rate
4%
Mortgage Type
New Conventional
Estimated Equity
$257,538
Purchase Details
Closed on
Nov 22, 2016
Sold by
Wells Fargo Bank Na
Bought by
St Cloud Ventures Llc
Purchase Details
Closed on
Aug 23, 2016
Sold by
Mubarak Hasan
Bought by
Wells Fargo Bank Na
Purchase Details
Closed on
Mar 15, 2005
Sold by
Krizek Builders Inc
Bought by
Mubarak Hasan
Home Financials for this Owner
Home Financials are based on the most recent Mortgage that was taken out on this home.
Original Mortgage
$260,905
Interest Rate
5.61%
Mortgage Type
FHA
Purchase Details
Closed on
May 5, 2004
Sold by
Larson Alvar
Bought by
Krizek Builders Inc
Create a Home Valuation Report for This Property
The Home Valuation Report is an in-depth analysis detailing your home's value as well as a comparison with similar homes in the area
Home Values in the Area
Average Home Value in this Area
Purchase History
| Date | Buyer | Sale Price | Title Company |
|---|---|---|---|
| Borkes Bethany L | $199,500 | Fidelity National Title | |
| St Cloud Ventures Llc | $120,279 | Servicelink Llc | |
| Wells Fargo Bank Na | -- | Attorney | |
| Mubarak Hasan | $265,000 | Metropolitan Title Co | |
| Krizek Builders Inc | $300,000 | First American Title Insuran |
Source: Public Records
Mortgage History
| Date | Status | Borrower | Loan Amount |
|---|---|---|---|
| Open | Borkes Bethany L | $159,600 | |
| Previous Owner | Mubarak Hasan | $260,905 |
Source: Public Records
Tax History Compared to Growth
Tax History
| Year | Tax Paid | Tax Assessment Tax Assessment Total Assessment is a certain percentage of the fair market value that is determined by local assessors to be the total taxable value of land and additions on the property. | Land | Improvement |
|---|---|---|---|---|
| 2024 | $10,222 | $102,128 | $5,703 | $96,425 |
| 2023 | $10,217 | $89,536 | $5,505 | $84,031 |
| 2022 | $10,217 | $85,809 | $5,378 | $80,431 |
| 2021 | $10,544 | $83,626 | $5,241 | $78,385 |
| 2020 | $10,361 | $79,803 | $5,001 | $74,802 |
| 2019 | $10,342 | $75,715 | $4,745 | $70,970 |
| 2018 | $9,445 | $67,594 | $5,656 | $61,938 |
| 2017 | $9,339 | $63,588 | $5,321 | $58,267 |
| 2016 | $9,125 | $60,537 | $5,066 | $55,471 |
| 2015 | $8,861 | $55,518 | $4,646 | $50,872 |
| 2014 | $9,359 | $59,055 | $12,480 | $46,575 |
| 2012 | $9,083 | $61,369 | $12,969 | $48,400 |
Source: Public Records
Map
Nearby Homes
- 10765 W Liberty Ave
- 1121 Otto Graham Ln
- 3931 Bertrand Ln
- 11345 W Carnahan Ave
- 38571 N Cedar Ave
- 11382 W Leland Ave
- 11342-11346 W Wadsworth Rd
- 3225 Gilead Ave
- 3224 Gilboa Ave
- 2614 33rd St
- 3221 Gideon Ave
- 38683 N Lewis Ave
- 1667 W Beach Rd Unit 1667
- 1677 W Beach Rd Unit 1677
- 1730 W Beach Rd
- 39161 N Holdridge Ave
- 3101 Gilboa Ave
- 10205 W Ames Ave
- 10295 W Crissy Ave
- 10133 W Wadsworth Rd
- 4213 Bertrand Ln
- 4205 Bertrand Ln
- 4201 Bertrand Ln
- 4217 Bertrand Ln
- 1123 Browne Ct
- 4147 Bertrand Ln
- 4221 Bertrand Ln
- 4206 Bertrand Ln
- 1104 Bank Ln
- 4225 Bertrand Ln
- 1127 Browne Ct
- 1122 Browne Ct
- 1100 Bank Ln
- 1124 Morris Ct
- 1108 Bank Ln
- 1121 Morris Ct
- 4229 Bertrand Ln
- 1131 Browne Ct
- 1126 Browne Ct
- 1130 Morris Ct