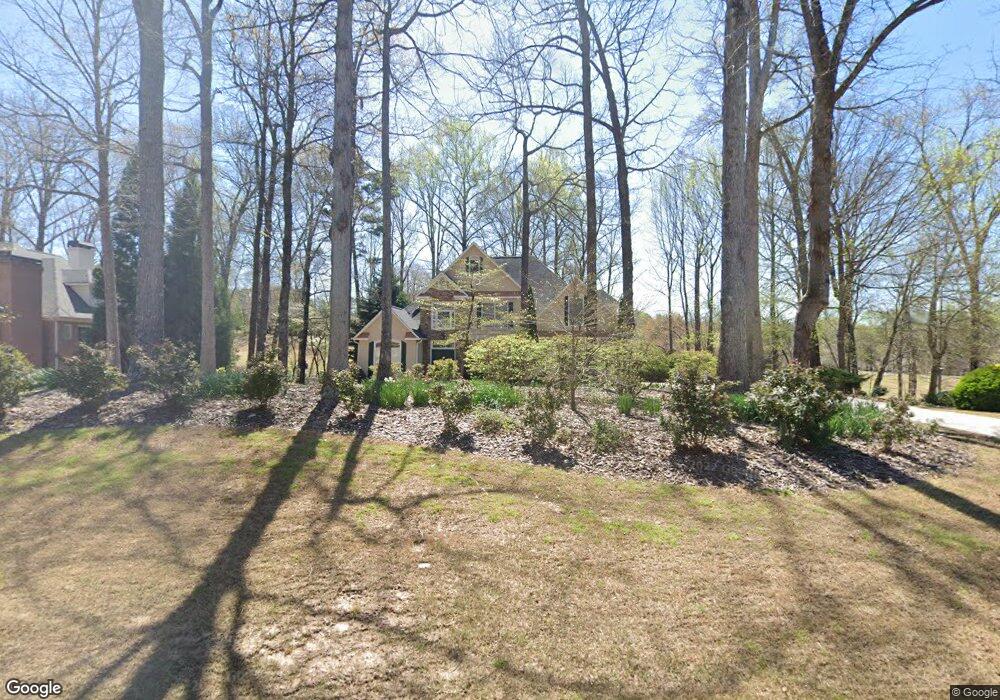
4209 Dunham Park Flowery Branch, GA 30542
Royal Lakes NeighborhoodEstimated Value: $658,881 - $726,000
4
Beds
3
Baths
2,679
Sq Ft
$260/Sq Ft
Est. Value
About This Home
This home is located at 4209 Dunham Park, Flowery Branch, GA 30542 and is currently estimated at $696,970, approximately $260 per square foot. 4209 Dunham Park is a home located in Hall County with nearby schools including Chicopee Elementary School, South Hall Middle School, and Johnson High School.
Ownership History
Date
Name
Owned For
Owner Type
Purchase Details
Closed on
Jul 30, 2002
Sold by
Boraski Edward A
Bought by
Boraski Edward A Eva A
Current Estimated Value
Purchase Details
Closed on
Jul 30, 2001
Sold by
Wood Morgan
Bought by
Boraski Edward A
Home Financials for this Owner
Home Financials are based on the most recent Mortgage that was taken out on this home.
Original Mortgage
$182,900
Interest Rate
6.97%
Mortgage Type
New Conventional
Purchase Details
Closed on
Mar 1, 1999
Sold by
Karle Steve G
Bought by
Wood Morgan G and Wood Ann Betty
Home Financials for this Owner
Home Financials are based on the most recent Mortgage that was taken out on this home.
Original Mortgage
$248,000
Interest Rate
6.84%
Mortgage Type
New Conventional
Purchase Details
Closed on
Sep 30, 1997
Sold by
Creative Contractors Inc
Bought by
Roosevelt Elwyn V
Purchase Details
Closed on
Jun 1, 1996
Create a Home Valuation Report for This Property
The Home Valuation Report is an in-depth analysis detailing your home's value as well as a comparison with similar homes in the area
Home Values in the Area
Average Home Value in this Area
Purchase History
| Date | Buyer | Sale Price | Title Company |
|---|---|---|---|
| Boraski Edward A Eva A | -- | -- | |
| Boraski Edward A | $382,900 | -- | |
| Wood Morgan G | $310,000 | -- | |
| Karle Steve G | $261,600 | -- | |
| Roosevelt Elwyn V | $200,000 | -- | |
| -- | $72,000 | -- |
Source: Public Records
Mortgage History
| Date | Status | Borrower | Loan Amount |
|---|---|---|---|
| Previous Owner | Boraski Edward A | $182,900 | |
| Previous Owner | Karle Steve G | $248,000 |
Source: Public Records
Tax History Compared to Growth
Tax History
| Year | Tax Paid | Tax Assessment Tax Assessment Total Assessment is a certain percentage of the fair market value that is determined by local assessors to be the total taxable value of land and additions on the property. | Land | Improvement |
|---|---|---|---|---|
| 2024 | $2,343 | $274,440 | $57,120 | $217,320 |
| 2023 | $2,000 | $245,160 | $43,560 | $201,600 |
| 2022 | $1,890 | $200,920 | $31,480 | $169,440 |
| 2021 | $1,730 | $172,800 | $25,720 | $147,080 |
| 2020 | $1,695 | $165,240 | $25,720 | $139,520 |
| 2019 | $1,799 | $171,880 | $39,560 | $132,320 |
| 2018 | $1,731 | $160,560 | $30,440 | $130,120 |
| 2017 | $1,430 | $139,240 | $20,240 | $119,000 |
| 2016 | $1,248 | $133,640 | $20,240 | $113,400 |
| 2015 | $1,247 | $133,640 | $20,240 | $113,400 |
| 2014 | $1,247 | $133,640 | $20,240 | $113,400 |
Source: Public Records
Map
Nearby Homes
- 4434 Oxburgh Park
- 4439 Oxburgh Park
- 4315 Marble Arch Way
- 0 Marble Arch Way
- 4478 Longmead Rd
- 4610 Blakeford Ct
- 4621 Chartwell Chase Ct
- 3969 Bolding Rd
- 4708 Upper Berkshire Rd Unit 39
- 4835 Upper Berkshire Rd
- 3929 Perry Ln
- 3617 Winder Hwy
- 3927 Celtic Ct
- 4135 Ashford Way
- 3582 Winder Hwy
- 4743 Amsterdam Ln
- 4838 Netherlands Place
- 4211 Quail Creek Dr
- 0 Dunham Park Unit 7015062
- 4213 Dunham Park
- 4205 Dunham Park
- 4210 Dunham Park
- 4206 Dunham Park
- 3411 Edgeworth Dr
- 4201 Dunham Park
- 4217 Dunham Park
- 4214 Dunham Park
- 4202 Dunham Park
- 4221 Dunham Park
- 4144 Sloan Mill Rd
- 4218 Dunham Park
- 4410 Oxburgh Park
- 4406 Oxburgh Park
- 4414 Oxburgh Park
- 4418 Oxburgh Park
- 4402 Oxburgh Park
- 4204 Edgeworth Dr
- 4205 Edgeworth Dr