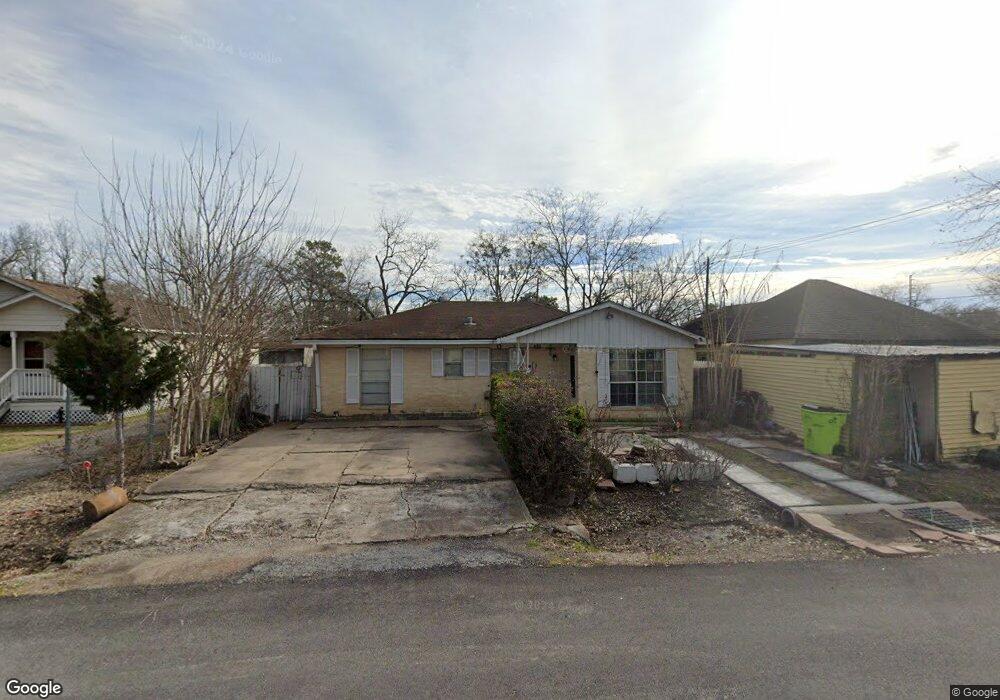
421 1st St Rosenberg, TX 77471
Estimated Value: $125,000 - $152,000
2
Beds
1
Bath
1,101
Sq Ft
$126/Sq Ft
Est. Value
About This Home
This home is located at 421 1st St, Rosenberg, TX 77471 and is currently estimated at $138,407, approximately $125 per square foot. 421 1st St is a home located in Fort Bend County with nearby schools including Jackson Elementary School, George Junior High School, and B.F. Terry High School.
Ownership History
Date
Name
Owned For
Owner Type
Purchase Details
Closed on
Jan 6, 2011
Sold by
Rodriguez Reynaldo Etal
Bought by
Rios Esperanza Rodriguez Etal
Current Estimated Value
Purchase Details
Closed on
Jan 19, 2001
Sold by
Rodriguez David R
Bought by
Rodriguez Reynaldo
Purchase Details
Closed on
Sep 29, 1999
Sold by
Rodriguez Esmeralda R
Bought by
Aguilar Eva Marie
Purchase Details
Closed on
Jul 8, 1999
Sold by
Dominguez Nora and Dominguez Carolyn
Bought by
Rodriguez Esmeralda R
Purchase Details
Closed on
Oct 22, 1996
Sold by
Rodriguez Eva
Bought by
Rios Esperanza Rodriguez Etal
Create a Home Valuation Report for This Property
The Home Valuation Report is an in-depth analysis detailing your home's value as well as a comparison with similar homes in the area
Home Values in the Area
Average Home Value in this Area
Purchase History
| Date | Buyer | Sale Price | Title Company |
|---|---|---|---|
| Rios Esperanza Rodriguez Etal | -- | -- | |
| Rodriguez Reynaldo | -- | -- | |
| Aguilar Eva Marie | -- | -- | |
| Rodriguez Esmeralda R | -- | American Title Company | |
| Rios Esperanza Rodriguez Etal | -- | -- |
Source: Public Records
Tax History
| Year | Tax Paid | Tax Assessment Tax Assessment Total Assessment is a certain percentage of the fair market value that is determined by local assessors to be the total taxable value of land and additions on the property. | Land | Improvement |
|---|---|---|---|---|
| 2025 | -- | $9,070 | $1,072 | $12,195 |
| 2024 | -- | $99,202 | $581 | $98,621 |
| 2023 | $0 | $93,407 | $0 | $99,560 |
| 2022 | $101 | $84,520 | $0 | $89,280 |
| 2021 | $899 | $43,340 | $7,500 | $35,840 |
| 2020 | $891 | $41,960 | $7,500 | $34,460 |
| 2019 | $988 | $43,270 | $7,500 | $35,770 |
| 2018 | $953 | $41,050 | $7,500 | $33,550 |
| 2017 | $930 | $39,830 | $7,500 | $32,330 |
| 2016 | $930 | $39,860 | $7,500 | $32,360 |
| 2015 | $964 | $41,090 | $7,500 | $33,590 |
| 2014 | $947 | $39,880 | $7,500 | $32,380 |
Source: Public Records
Map
Nearby Homes
Your Personal Tour Guide
Ask me questions while you tour the home.