Estimated Value: $50,000 - $109,000
3
Beds
1
Bath
1,424
Sq Ft
$61/Sq Ft
Est. Value
About This Home
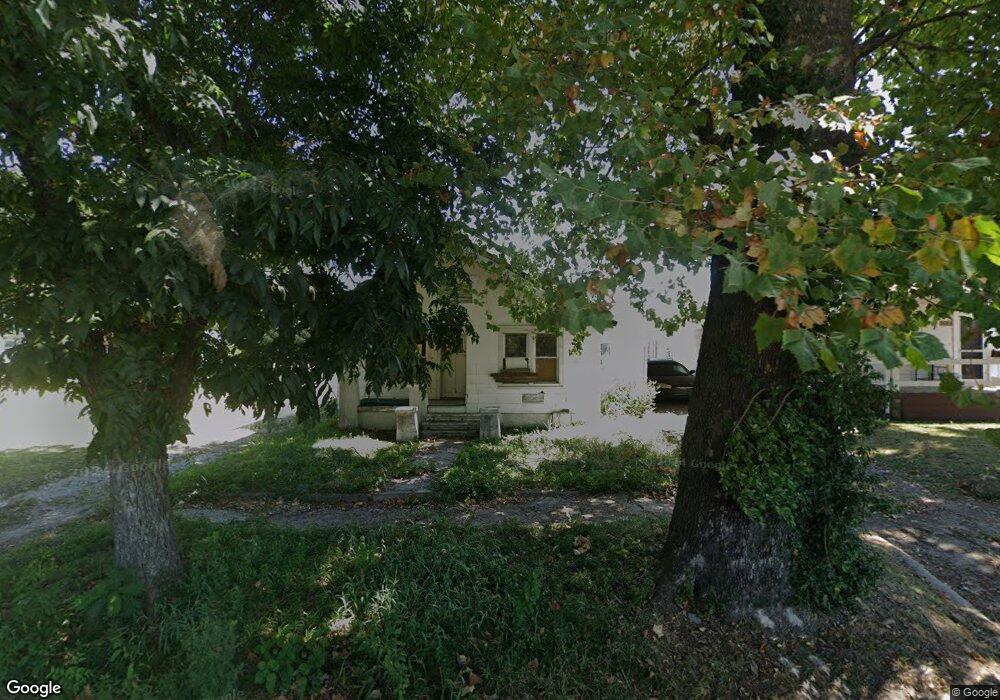
This home is located at 421 A St SW, Miami, OK 74354 and is currently estimated at $86,280, approximately $60 per square foot. 421 A St SW is a home located in Ottawa County with nearby schools including Miami High School and Mt. Olive Lutheran School.
Ownership History
Date
Name
Owned For
Owner Type
Purchase Details
Closed on
Sep 14, 2018
Sold by
Estes Collision & Towing Llc
Bought by
Proctor Marlene D
Current Estimated Value
Purchase Details
Closed on
Mar 15, 2017
Sold by
Fannie Mae
Bought by
Estes Collision & Towing Llc
Purchase Details
Closed on
Apr 22, 2004
Bought by
Ekstrom Shane D
Purchase Details
Closed on
Apr 5, 2002
Bought by
Johnson Ernest and Johnson Mary
Purchase Details
Closed on
Apr 17, 1997
Bought by
Kress John and Kress Genii
Purchase Details
Closed on
Feb 5, 1997
Bought by
Johnson Ernest and Johnson Mary
Create a Home Valuation Report for This Property
The Home Valuation Report is an in-depth analysis detailing your home's value as well as a comparison with similar homes in the area
Purchase History
| Date | Buyer | Sale Price | Title Company |
|---|---|---|---|
| Proctor Marlene D | $3,000 | None Available | |
| Estes Collision & Towing Llc | $1,000 | Oklahoma Reo Closing & Title | |
| Ekstrom Shane D | $46,500 | -- | |
| Johnson Ernest | -- | -- | |
| Kress John | $32,000 | -- | |
| Johnson Ernest | $15,500 | -- |
Source: Public Records
Tax History
| Year | Tax Paid | Tax Assessment Tax Assessment Total Assessment is a certain percentage of the fair market value that is determined by local assessors to be the total taxable value of land and additions on the property. | Land | Improvement |
|---|---|---|---|---|
| 2025 | $279 | $2,901 | $113 | $2,788 |
| 2024 | $266 | $2,763 | $113 | $2,650 |
| 2023 | $266 | $2,631 | $113 | $2,518 |
| 2022 | $232 | $2,506 | $113 | $2,393 |
| 2021 | $226 | $2,387 | $113 | $2,274 |
| 2020 | $217 | $2,273 | $113 | $2,160 |
| 2019 | $437 | $5,321 | $113 | $5,208 |
| 2018 | $298 | $3,611 | $113 | $3,498 |
| 2017 | $289 | $3,439 | $113 | $3,326 |
| 2016 | $263 | $3,276 | $113 | $3,163 |
| 2015 | $471 | $5,301 | $233 | $5,068 |
| 2014 | $256 | $3,120 | $113 | $3,007 |
Source: Public Records
Map
Nearby Homes
Your Personal Tour Guide
Ask me questions while you tour the home.