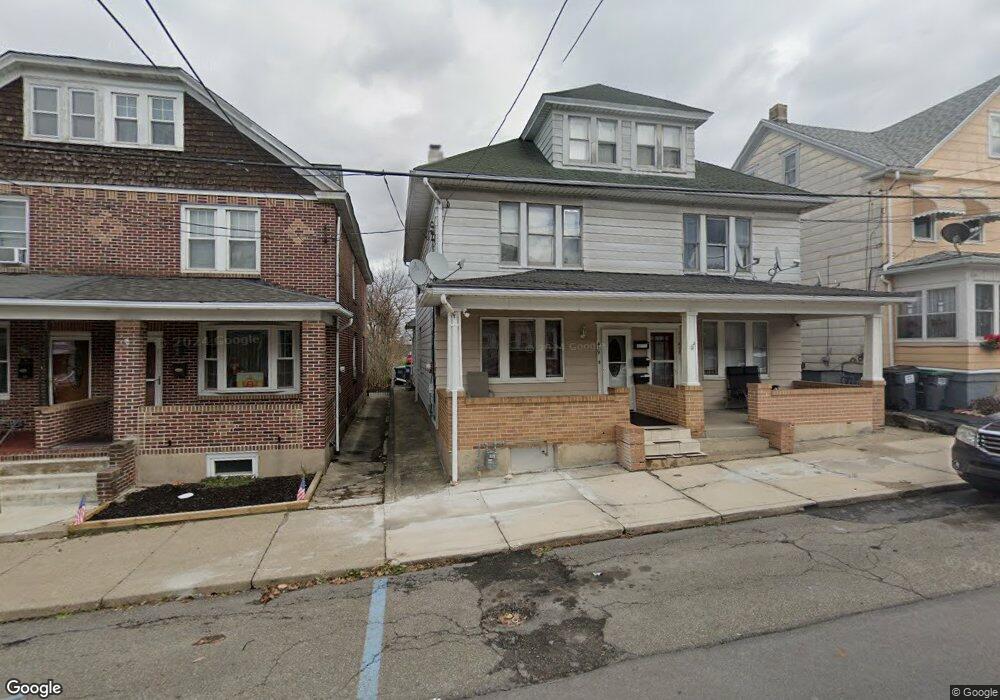
421 Allen St West Hazleton, PA 18202
Estimated Value: $155,166 - $206,000
Studio
--
Bath
1,600
Sq Ft
$109/Sq Ft
Est. Value
About This Home
This home is located at 421 Allen St, West Hazleton, PA 18202 and is currently estimated at $174,792, approximately $109 per square foot. 421 Allen St is a home located in Luzerne County with nearby schools including Hazleton Area High School, Immanuel Christian School, and Bishop Hafey Junior/Senior High School.
Ownership History
Date
Name
Owned For
Owner Type
Purchase Details
Closed on
Jun 13, 2006
Sold by
Radziewicz Joan M
Bought by
Yanochko Ann M and Yanochko David E
Current Estimated Value
Purchase Details
Closed on
May 12, 2006
Sold by
Dubravski Ann M and Yanochko Amm M
Bought by
Radziewicz John H
Create a Home Valuation Report for This Property
The Home Valuation Report is an in-depth analysis detailing your home's value as well as a comparison with similar homes in the area
Home Values in the Area
Average Home Value in this Area
Purchase History
| Date | Buyer | Sale Price | Title Company |
|---|---|---|---|
| Yanochko Ann M | -- | None Available | |
| Radziewicz John H | -- | None Available |
Source: Public Records
Tax History
| Year | Tax Paid | Tax Assessment Tax Assessment Total Assessment is a certain percentage of the fair market value that is determined by local assessors to be the total taxable value of land and additions on the property. | Land | Improvement |
|---|---|---|---|---|
| 2026 | $2,423 | $86,800 | $20,100 | $66,700 |
| 2025 | $2,189 | $86,800 | $20,100 | $66,700 |
| 2024 | $2,117 | $86,800 | $20,100 | $66,700 |
| 2023 | $2,062 | $86,800 | $20,100 | $66,700 |
| 2022 | $2,046 | $86,800 | $20,100 | $66,700 |
| 2021 | $1,996 | $86,800 | $20,100 | $66,700 |
| 2020 | $1,968 | $86,800 | $20,100 | $66,700 |
| 2019 | $1,815 | $86,800 | $20,100 | $66,700 |
| 2018 | $1,758 | $86,800 | $20,100 | $66,700 |
| 2017 | $1,727 | $86,800 | $20,100 | $66,700 |
| 2016 | -- | $86,800 | $20,100 | $66,700 |
| 2015 | $1,047 | $86,800 | $20,100 | $66,700 |
| 2014 | $1,047 | $86,800 | $20,100 | $66,700 |
Source: Public Records
Map
Nearby Homes
- 60 E Jefferson Ave
- 608 Mckinley St
- 218 North St
- 118 E Green St
- 239 Lincalis St
- 328 W Green St
- 1 W Diamond Ave
- 829 W 21st St
- AV1.022 Sisilla Dr
- 370 Inverness Ln
- EH-391 Birkdale Ct
- TV 202 Buttonbush & White Oak Ln
- 29 J Jahanna Cir
- 49 Creekside Dr
- 12 AV2 Opalanie Dr
- HF4.107 Acorn Dr
- LV-277 Laurel Valley Rd
- 174 S Forest Creek Dr
- Lot 11 Chippewa Dr
- 403 W 7th St
Your Personal Tour Guide
Ask me questions while you tour the home.