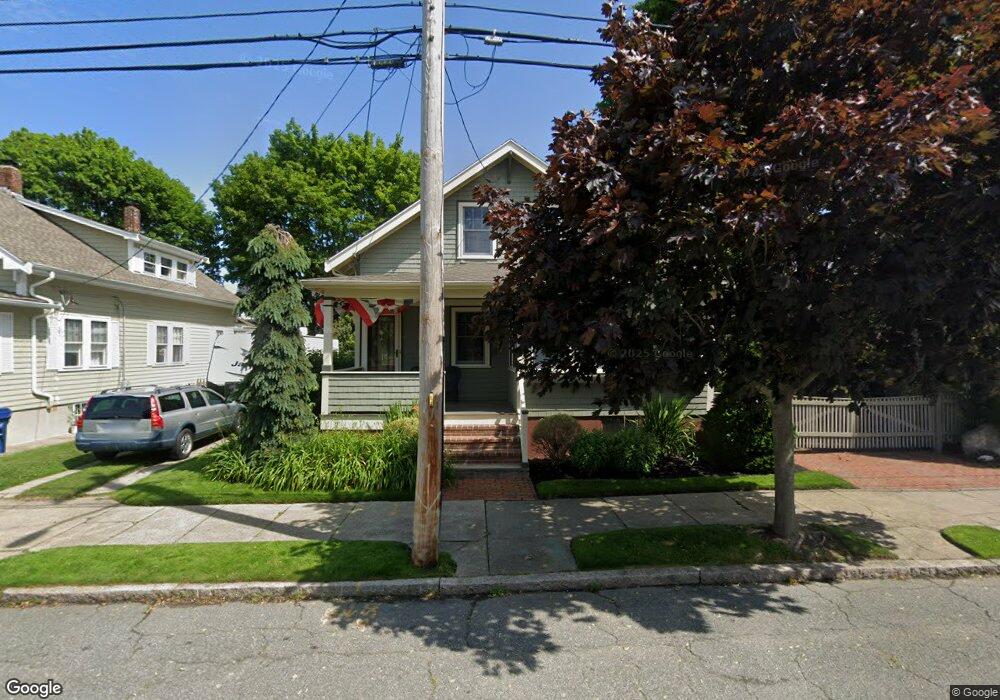
421 Bedford St New Bedford, MA 02740
Downtown New Bedford NeighborhoodEstimated Value: $458,000 - $492,000
3
Beds
2
Baths
1,561
Sq Ft
$306/Sq Ft
Est. Value
About This Home
This home is located at 421 Bedford St, New Bedford, MA 02740 and is currently estimated at $476,982, approximately $305 per square foot. 421 Bedford St is a home located in Bristol County with nearby schools including Betsey B. Winslow Elementary School, Keith Middle School, and New Bedford High School.
Ownership History
Date
Name
Owned For
Owner Type
Purchase Details
Closed on
Oct 26, 2009
Sold by
Henry Kathleen A and Arruda Kathleen
Bought by
Henry Kathleen A and West John P
Current Estimated Value
Purchase Details
Closed on
Oct 18, 2006
Sold by
New Bedford City Treas
Bought by
Henry Kathleen A
Create a Home Valuation Report for This Property
The Home Valuation Report is an in-depth analysis detailing your home's value as well as a comparison with similar homes in the area
Home Values in the Area
Average Home Value in this Area
Purchase History
| Date | Buyer | Sale Price | Title Company |
|---|---|---|---|
| Henry Kathleen A | -- | -- | |
| Henry Kathleen A | -- | -- | |
| Henry Kathleen A | $3,986 | -- | |
| Henry Kathleen A | $3,986 | -- |
Source: Public Records
Mortgage History
| Date | Status | Borrower | Loan Amount |
|---|---|---|---|
| Previous Owner | Henry Kathleen A | $236,000 |
Source: Public Records
Tax History Compared to Growth
Tax History
| Year | Tax Paid | Tax Assessment Tax Assessment Total Assessment is a certain percentage of the fair market value that is determined by local assessors to be the total taxable value of land and additions on the property. | Land | Improvement |
|---|---|---|---|---|
| 2025 | $4,959 | $438,500 | $125,600 | $312,900 |
| 2024 | $4,657 | $388,100 | $119,700 | $268,400 |
| 2023 | $5,052 | $353,500 | $107,100 | $246,400 |
| 2022 | $4,609 | $296,600 | $102,000 | $194,600 |
| 2021 | $4,512 | $289,400 | $102,000 | $187,400 |
| 2020 | $4,421 | $273,600 | $106,000 | $167,600 |
| 2019 | $4,284 | $260,100 | $107,900 | $152,200 |
| 2018 | $4,023 | $241,900 | $107,900 | $134,000 |
| 2017 | $3,812 | $228,400 | $107,900 | $120,500 |
| 2016 | $3,542 | $214,800 | $102,000 | $112,800 |
| 2015 | $3,369 | $214,200 | $106,000 | $108,200 |
| 2014 | $3,241 | $213,800 | $107,900 | $105,900 |
Source: Public Records
Map
Nearby Homes
- 427 Bedford St
- 72 Ryan St Unit 74
- 409 Bedford St
- 61 Brownell St Unit 63
- 431 Bedford St
- 82 Ryan St
- 439 Bedford St Unit 441
- 90 Ryan St
- 60 Brownell St
- 68 Brownell St
- 67 Ryan St
- 69 Ryan St
- 54 Brownell St
- 65 Ryan St
- 79 Ryan St
- 404 Bedford St Unit 406
- 87 Ryan St Unit 89
- 449 Bedford St
- 96 Ryan St
- 46 Brownell St