Estimated Value: $119,000 - $171,949
4
Beds
2
Baths
1,450
Sq Ft
$108/Sq Ft
Est. Value
About This Home
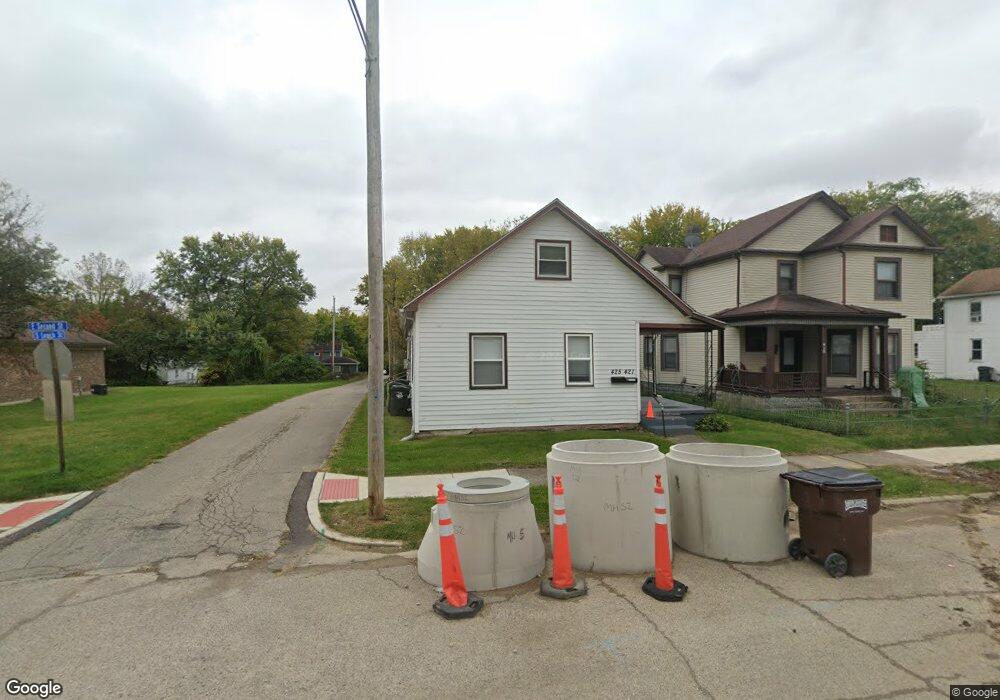
This home is located at 421 E 2nd St, Xenia, OH 45385 and is currently estimated at $157,237, approximately $108 per square foot. 421 E 2nd St is a home located in Greene County with nearby schools including Xenia High School, Summit Academy Community School for Alternative Learners - Xenia, and Legacy Christian Academy.
Ownership History
Date
Name
Owned For
Owner Type
Purchase Details
Closed on
Jun 22, 2021
Sold by
Williams Daryle M and Williams Jessica L
Bought by
Sfr3-030 Llc
Current Estimated Value
Purchase Details
Closed on
May 17, 2018
Sold by
Williams Johnnie Daryle and Williams Sharon
Bought by
Williams Daryle M
Home Financials for this Owner
Home Financials are based on the most recent Mortgage that was taken out on this home.
Original Mortgage
$15,000
Interest Rate
4.4%
Mortgage Type
New Conventional
Purchase Details
Closed on
Sep 23, 2016
Bought by
Williams Johnnie Daryle
Create a Home Valuation Report for This Property
The Home Valuation Report is an in-depth analysis detailing your home's value as well as a comparison with similar homes in the area
Home Values in the Area
Average Home Value in this Area
Purchase History
| Date | Buyer | Sale Price | Title Company |
|---|---|---|---|
| Sfr3-030 Llc | -- | None Listed On Document | |
| Williams Daryle M | $20,000 | None Available | |
| Williams Johnnie Daryle | -- | -- |
Source: Public Records
Mortgage History
| Date | Status | Borrower | Loan Amount |
|---|---|---|---|
| Previous Owner | Williams Daryle M | $15,000 |
Source: Public Records
Tax History
| Year | Tax Paid | Tax Assessment Tax Assessment Total Assessment is a certain percentage of the fair market value that is determined by local assessors to be the total taxable value of land and additions on the property. | Land | Improvement |
|---|---|---|---|---|
| 2024 | $2,158 | $49,540 | $1,580 | $47,960 |
| 2023 | $2,120 | $49,540 | $1,580 | $47,960 |
| 2022 | $1,741 | $34,700 | $1,440 | $33,260 |
| 2021 | $657 | $12,920 | $1,440 | $11,480 |
| 2020 | $629 | $12,920 | $1,440 | $11,480 |
| 2019 | $578 | $11,170 | $1,450 | $9,720 |
| 2018 | $580 | $11,170 | $1,450 | $9,720 |
| 2017 | $564 | $11,170 | $1,450 | $9,720 |
| 2016 | $566 | $10,690 | $1,450 | $9,240 |
| 2015 | $568 | $10,690 | $1,450 | $9,240 |
| 2014 | $543 | $10,690 | $1,450 | $9,240 |
Source: Public Records
Map
Nearby Homes
Your Personal Tour Guide
Ask me questions while you tour the home.