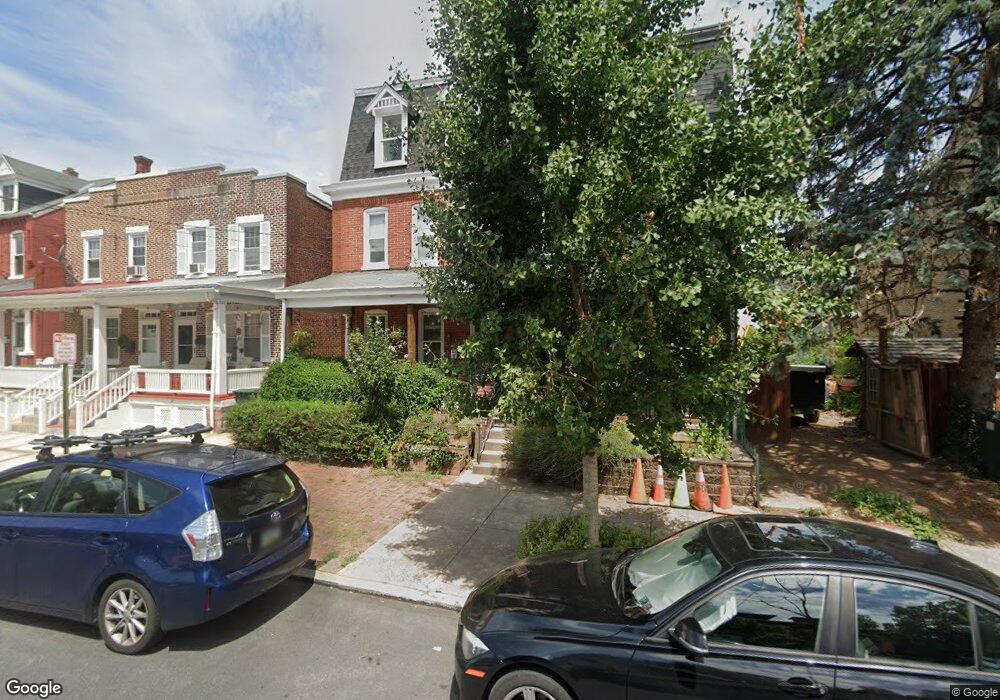
421 E Clay St Lancaster, PA 17602
Ross NeighborhoodEstimated Value: $305,000 - $338,000
About This Home
This home is located at 421 E Clay St, Lancaster, PA 17602 and is currently estimated at $321,059, approximately $159 per square foot. 421 E Clay St is a home located in Lancaster County with nearby schools including Ross Elementary School, Lincoln Middle School, and McCaskey High School.
Ownership History
We collect this data history from publicly available records. To have your information removed, we recommend requesting removal directly through your county’s website.
Purchase Details
Home Financials for this Owner
Home Financials are based on the most recent Mortgage that was taken out on this home.Home Values in the Area
Average Home Value in this Area
Purchase History
We collect this data history from publicly available records. To have your information removed, we recommend requesting removal directly through your county’s website.
| Date | Buyer | Sale Price | Title Company |
|---|---|---|---|
| $105,000 | Title Services |
Mortgage History
We collect this data history from publicly available records. To have your information removed, we recommend requesting removal directly through your county’s website.
| Date | Status | Borrower | Loan Amount |
|---|---|---|---|
| Open | $70,000 |
Tax History
We collect this data history from publicly available records. To have your information removed, we recommend requesting removal directly through your county’s website.
| Year | Tax Paid | Tax Assessment Tax Assessment Total Assessment is a certain percentage of the fair market value that is determined by local assessors to be the total taxable value of land and additions on the property. | Land | Improvement |
|---|---|---|---|---|
| 2026 | $4,199 | $105,000 | $24,200 | $80,800 |
| 2025 | $4,155 | $105,000 | $24,200 | $80,800 |
| 2024 | $4,155 | $105,000 | $24,200 | $80,800 |
| 2023 | $4,085 | $105,000 | $24,200 | $80,800 |
| 2022 | $3,915 | $105,000 | $24,200 | $80,800 |
| 2021 | $3,831 | $105,000 | $24,200 | $80,800 |
| 2020 | $3,831 | $105,000 | $24,200 | $80,800 |
| 2019 | $3,774 | $105,000 | $24,200 | $80,800 |
| 2018 | $4,396 | $105,000 | $24,200 | $80,800 |
| 2017 | $3,854 | $83,900 | $16,400 | $67,500 |
| 2016 | $3,818 | $83,900 | $16,400 | $67,500 |
| 2015 | $1,490 | $83,900 | $16,400 | $67,500 |
| 2014 | $3,332 | $83,900 | $16,400 | $67,500 |
Map
- 361 E Ross St
- 355 E Ross St
- 352 E New St
- 348 E New St
- 364 E Liberty St
- 318 E Liberty St
- 256 E Ross St
- 304 E New St
- 413 Hamilton St
- 549 N Plum St
- 227 E Ross St
- 699 New Holland Ave
- 214 E New St
- 146 E Clay St
- 144 E Liberty St
- 923 Lititz Ave
- 147 E Liberty St
- 1103 Frances Ave
- 752 New Holland Ave
- 762 New Holland Ave
- 433 E Clay St
- 431 E Clay St
- 429 E Clay St
- 427 E Clay St
- 439 E Clay St
- 425 E Clay St
- 806 N Ann St Unit Newly built 1 bedroo
- 806 N Ann St
- 808 N Ann St
- 812 N Ann St
- 423 E Clay St
- 443 E Clay St
- 802 N Ann St
- 419 E Clay St
- 417 E Clay St
- 438 E Ross St
- 440 E Ross St
- 442 E Ross St
- 436 E Ross St
- 444 E Ross St
Ask me questions while you tour the home.