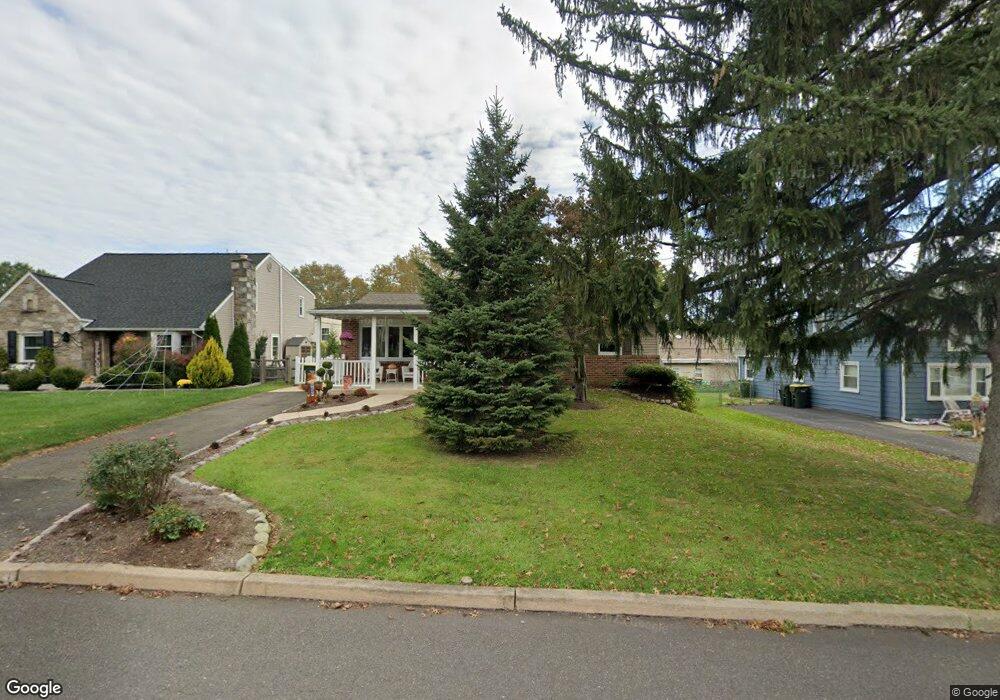
421 Exton Rd Hatboro, PA 19040
Upper Moreland NeighborhoodEstimated Value: $321,000 - $412,000
3
Beds
2
Baths
1,092
Sq Ft
$338/Sq Ft
Est. Value
About This Home
This home is located at 421 Exton Rd, Hatboro, PA 19040 and is currently estimated at $368,979, approximately $337 per square foot. 421 Exton Rd is a home located in Montgomery County with nearby schools including Upper Moreland Primary School, Upper Moreland Intermediate School, and Upper Moreland Middle School.
Ownership History
Date
Name
Owned For
Owner Type
Purchase Details
Closed on
May 24, 2021
Sold by
Barron Michael P
Bought by
Barron Michael P and Barron Nicole M
Current Estimated Value
Home Financials for this Owner
Home Financials are based on the most recent Mortgage that was taken out on this home.
Original Mortgage
$137,400
Outstanding Balance
$124,127
Interest Rate
2.9%
Mortgage Type
New Conventional
Estimated Equity
$244,852
Purchase Details
Closed on
Nov 16, 2009
Sold by
Barron Michael P and Barron Julie E
Bought by
Barron Michael P
Home Financials for this Owner
Home Financials are based on the most recent Mortgage that was taken out on this home.
Original Mortgage
$216,218
Interest Rate
5%
Purchase Details
Closed on
Jul 30, 2001
Sold by
Francica Frank and Francica Nancy F
Bought by
Barron Michael P and Barron Julie E
Purchase Details
Closed on
Feb 17, 1997
Sold by
Francica Frank
Bought by
Francica Frank
Create a Home Valuation Report for This Property
The Home Valuation Report is an in-depth analysis detailing your home's value as well as a comparison with similar homes in the area
Home Values in the Area
Average Home Value in this Area
Purchase History
| Date | Buyer | Sale Price | Title Company |
|---|---|---|---|
| Barron Michael P | -- | None Available | |
| Barron Michael P | -- | None Available | |
| Barron Michael P | $155,000 | -- | |
| Francica Frank | -- | -- |
Source: Public Records
Mortgage History
| Date | Status | Borrower | Loan Amount |
|---|---|---|---|
| Open | Barron Michael P | $137,400 | |
| Closed | Barron Michael P | $216,218 |
Source: Public Records
Tax History Compared to Growth
Tax History
| Year | Tax Paid | Tax Assessment Tax Assessment Total Assessment is a certain percentage of the fair market value that is determined by local assessors to be the total taxable value of land and additions on the property. | Land | Improvement |
|---|---|---|---|---|
| 2025 | $5,717 | $120,250 | $44,740 | $75,510 |
| 2024 | $5,717 | $120,250 | $44,740 | $75,510 |
| 2023 | $5,479 | $120,250 | $44,740 | $75,510 |
| 2022 | $5,152 | $120,250 | $44,740 | $75,510 |
| 2021 | $5,083 | $120,250 | $44,740 | $75,510 |
| 2020 | $4,915 | $120,250 | $44,740 | $75,510 |
| 2019 | $4,807 | $120,250 | $44,740 | $75,510 |
| 2018 | $4,808 | $120,250 | $44,740 | $75,510 |
| 2017 | $4,592 | $120,250 | $44,740 | $75,510 |
| 2016 | $4,546 | $120,250 | $44,740 | $75,510 |
| 2015 | $4,313 | $120,250 | $44,740 | $75,510 |
| 2014 | $4,313 | $120,250 | $44,740 | $75,510 |
Source: Public Records
Map
Nearby Homes
- 513 Corinthian Ave
- 416 Preston Ln
- 205 Willard Rd
- 2900 E County Line Rd
- 2710 E County Line Rd
- 210 E Montgomery Ave
- 148 Byberry Rd
- 136 Washington Dr
- 2410 Exton Rd
- 4145 Thistlewood Rd
- 36 Jessop Ln
- 620 Constitutional Dr
- 2505 Damian Dr
- 45 Fulmor Ave
- 102 Earl Ln
- 194 Ann Ln
- 725 E County Line Rd
- 165 W Moreland Ave
- 219 W Moreland Ave
- 4280 Frontier Rd