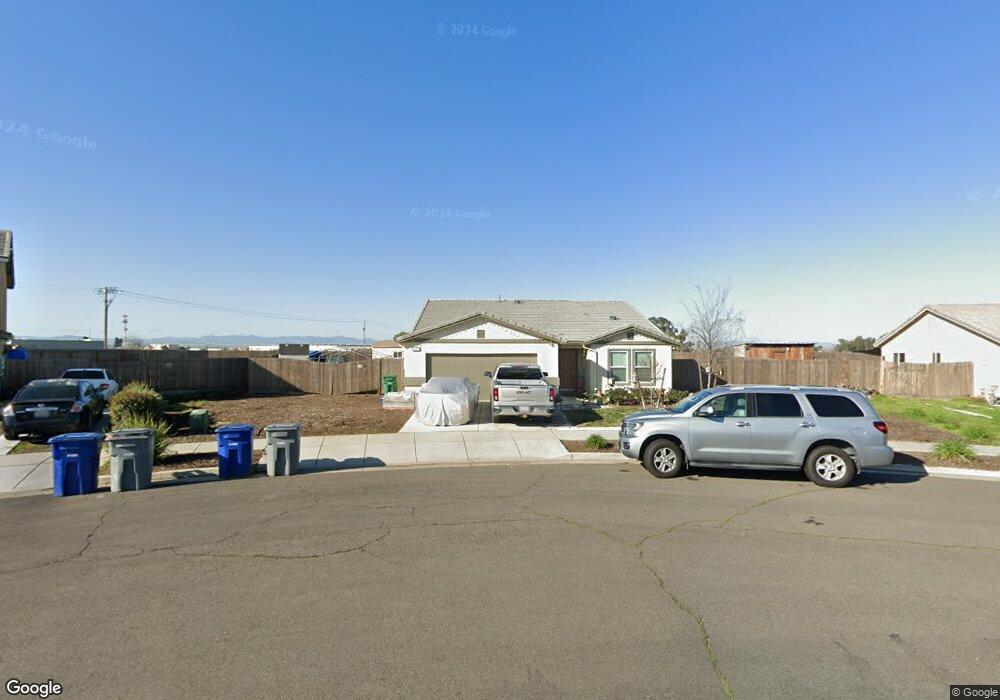
421 Gallo St Los Banos, CA 93635
Estimated Value: $479,977 - $521,000
4
Beds
2
Baths
1,795
Sq Ft
$279/Sq Ft
Est. Value
About This Home
This home is located at 421 Gallo St, Los Banos, CA 93635 and is currently estimated at $501,244, approximately $279 per square foot. 421 Gallo St is a home with nearby schools including Lorena Falasco Elementary School, Los Banos Junior High School, and Pacheco High School.
Ownership History
Date
Name
Owned For
Owner Type
Purchase Details
Closed on
Jul 24, 2019
Sold by
D R Horton Ca3 Inc
Bought by
Zuniga Robert
Current Estimated Value
Home Financials for this Owner
Home Financials are based on the most recent Mortgage that was taken out on this home.
Original Mortgage
$319,495
Interest Rate
3.6%
Mortgage Type
FHA
Purchase Details
Closed on
Jan 18, 2019
Sold by
Central California Irrigation District
Bought by
D R Horton Ca3 Inc
Purchase Details
Closed on
Feb 28, 2015
Sold by
Cast N Blast Lp
Bought by
Trevino Pioneer Llc
Purchase Details
Closed on
Dec 16, 2009
Sold by
Orchard Terrace Estates Llc
Bought by
Cast N Blast Lp
Home Financials for this Owner
Home Financials are based on the most recent Mortgage that was taken out on this home.
Original Mortgage
$290,250
Interest Rate
4.88%
Mortgage Type
Seller Take Back
Create a Home Valuation Report for This Property
The Home Valuation Report is an in-depth analysis detailing your home's value as well as a comparison with similar homes in the area
Home Values in the Area
Average Home Value in this Area
Purchase History
| Date | Buyer | Sale Price | Title Company |
|---|---|---|---|
| Zuniga Robert | $360,000 | First American Title Company | |
| D R Horton Ca3 Inc | -- | None Available | |
| Trevino Pioneer Llc | $625,000 | Fidelity National Title Co | |
| Cast N Blast Lp | -- | Fidelity Natl Title Co Of Ca |
Source: Public Records
Mortgage History
| Date | Status | Borrower | Loan Amount |
|---|---|---|---|
| Previous Owner | Zuniga Robert | $319,495 | |
| Previous Owner | Cast N Blast Lp | $290,250 |
Source: Public Records
Tax History
| Year | Tax Paid | Tax Assessment Tax Assessment Total Assessment is a certain percentage of the fair market value that is determined by local assessors to be the total taxable value of land and additions on the property. | Land | Improvement |
|---|---|---|---|---|
| 2025 | $5,979 | $407,707 | $92,956 | $314,751 |
| 2024 | $5,979 | $385,988 | $91,134 | $294,854 |
| 2023 | $5,670 | $378,421 | $89,348 | $289,073 |
| 2022 | $5,546 | $371,002 | $87,597 | $283,405 |
| 2021 | $5,442 | $363,729 | $85,880 | $277,849 |
| 2020 | $5,363 | $360,000 | $85,000 | $275,000 |
| 2019 | $2,507 | $103,500 | $103,500 | $0 |
| 2018 | $955 | $52,812 | $52,812 | $0 |
| 2017 | $914 | $51,777 | $51,777 | $0 |
| 2016 | $913 | $50,762 | $50,762 | $0 |
| 2015 | $441 | $9,233 | $9,233 | $0 |
| 2014 | $409 | $9,053 | $9,053 | $0 |
Source: Public Records
Map
Nearby Homes
- 381 Honeybell St
- 446 Port St
- 14368 Johnson Rd
- 537 Elmwood Dr
- 608 Machado St
- 543 Machado St
- 229 E St
- 212 F St
- 826 Grace Dr
- 517 Pinion St
- 713 Cabernet St
- 869 Grace Dr
- 558 Cedarwood Ct
- 860 Fritz Dr
- 649 Betten St
- 621 Vine St
- 2114 Coulter Ln Unit 393P
- 0 Santa Lucia Rd
- 644 Winemaker St
- 0 W I St Unit ML81999689
Your Personal Tour Guide
Ask me questions while you tour the home.