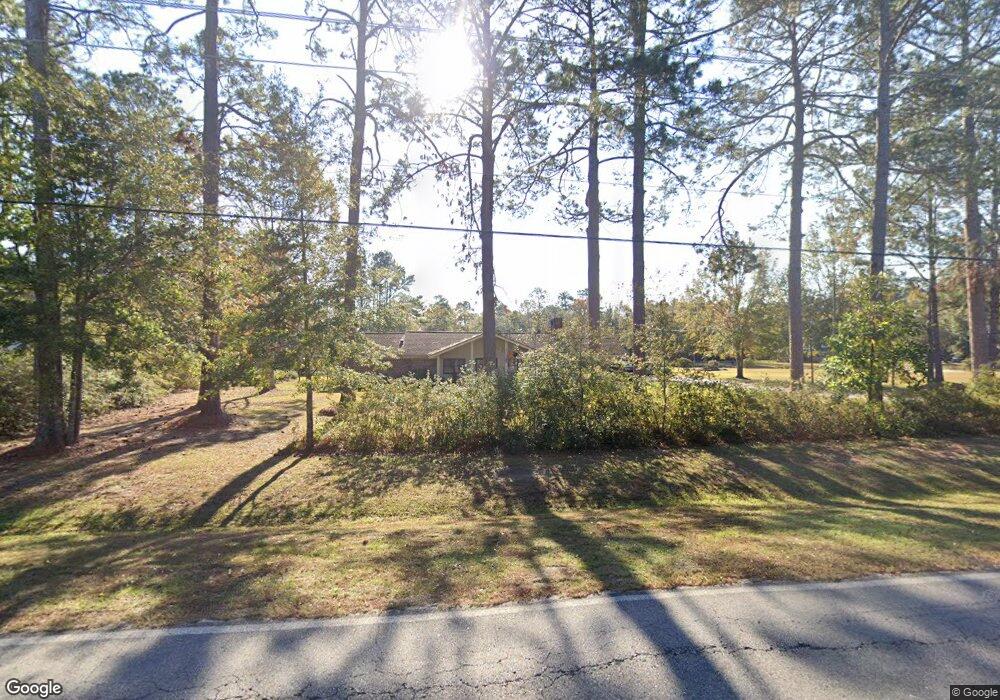
421 Kolic Helmey Rd Guyton, GA 31312
Estimated Value: $331,406 - $389,000
--
Bed
1
Bath
1,984
Sq Ft
$184/Sq Ft
Est. Value
About This Home
This home is located at 421 Kolic Helmey Rd, Guyton, GA 31312 and is currently estimated at $365,102, approximately $184 per square foot. 421 Kolic Helmey Rd is a home located in Effingham County with nearby schools including South Effingham Elementary School, South Effingham Middle School, and South Effingham High School.
Ownership History
Date
Name
Owned For
Owner Type
Purchase Details
Closed on
Sep 21, 2010
Sold by
Hampton Wallace Ray
Bought by
Hampton Wallace Ray and Hampton Darlene Renee
Current Estimated Value
Home Financials for this Owner
Home Financials are based on the most recent Mortgage that was taken out on this home.
Original Mortgage
$184,500
Interest Rate
4.42%
Mortgage Type
New Conventional
Purchase Details
Closed on
Sep 16, 2005
Sold by
Gunnels David
Bought by
Hampton Wallace Ray
Home Financials for this Owner
Home Financials are based on the most recent Mortgage that was taken out on this home.
Original Mortgage
$180,865
Interest Rate
5.77%
Mortgage Type
New Conventional
Purchase Details
Closed on
Jun 17, 2005
Sold by
Boyd William J
Bought by
Gunnels David and Gunnels Judy S
Create a Home Valuation Report for This Property
The Home Valuation Report is an in-depth analysis detailing your home's value as well as a comparison with similar homes in the area
Home Values in the Area
Average Home Value in this Area
Purchase History
| Date | Buyer | Sale Price | Title Company |
|---|---|---|---|
| Hampton Wallace Ray | -- | -- | |
| Hampton Wallace Ray | $226,085 | -- | |
| Gunnels David | $265,000 | -- |
Source: Public Records
Mortgage History
| Date | Status | Borrower | Loan Amount |
|---|---|---|---|
| Closed | Hampton Wallace Ray | $184,500 | |
| Previous Owner | Hampton Wallace Ray | $180,865 | |
| Previous Owner | Hampton Wallace Ray | $22,600 | |
| Closed | Gunnels David | $0 |
Source: Public Records
Tax History Compared to Growth
Tax History
| Year | Tax Paid | Tax Assessment Tax Assessment Total Assessment is a certain percentage of the fair market value that is determined by local assessors to be the total taxable value of land and additions on the property. | Land | Improvement |
|---|---|---|---|---|
| 2025 | $3,113 | $115,363 | $28,523 | $86,840 |
| 2024 | $3,113 | $92,206 | $21,490 | $70,716 |
| 2023 | $2,174 | $86,662 | $21,490 | $65,172 |
| 2022 | $2,531 | $78,707 | $13,535 | $65,172 |
| 2021 | $2,329 | $71,610 | $9,254 | $62,356 |
| 2020 | $2,151 | $66,362 | $11,341 | $55,021 |
| 2019 | $2,051 | $62,558 | $7,537 | $55,021 |
| 2018 | $2,137 | $64,722 | $13,382 | $51,340 |
| 2017 | $2,154 | $64,722 | $13,382 | $51,340 |
| 2016 | $1,865 | $57,865 | $13,382 | $44,484 |
| 2015 | -- | $57,866 | $13,382 | $44,484 |
| 2014 | -- | $57,865 | $13,382 | $44,484 |
| 2013 | -- | $57,865 | $13,381 | $44,483 |
Source: Public Records
Map
Nearby Homes
- 460 Kolic Helmey Rd
- 106 Saddle Ln
- 259 Zettler Loop
- 310 Keen Way
- 203 Orchard Dr
- 0 Hodgeville Rd Unit SA341541
- 0 Hodgeville Rd Unit 10622997
- 103 Brindlewood Dr
- 257 Cypress Creek Ln
- 118 Red Maple Ln
- 172 Green Paddock Cir
- 154 Clover Point Cir
- 217 Cypress Creek Ln
- 158 Clover Point Cir
- 137 Saddleclub Way
- 2410 Hodgeville Rd
- 143 Summer Station Dr
- 116 Bluegrass Cir
- 162 Saddleclub Way
- 102 Winnai Ln
- 395 Kolic Helmey Rd
- 0 Forest Haven Dr
- 0 Forest Haven Dr Unit 8417790
- 172 Kensington Cir
- 174 Kensington Cir
- 169 Earl Lain Rd
- 170 Kensington Cir
- 377 Kolic Helmey Rd
- 110 Earl Lain Rd
- 0 Kensington Dr Unit 7046536
- 102 Kensington Cir
- 168 Kensington Cir
- 0 Kensington Cir
- 0 Kensington Cir Unit 8667496
- 0 Kensington Cir Unit 8631007
- 0 Kensington Cir Unit 8263295
- 0 Kensington Cir Unit 7468497
- 147 Kensington Cir
- 369 Kolic Helmey Rd
- 104 Kensington Cir