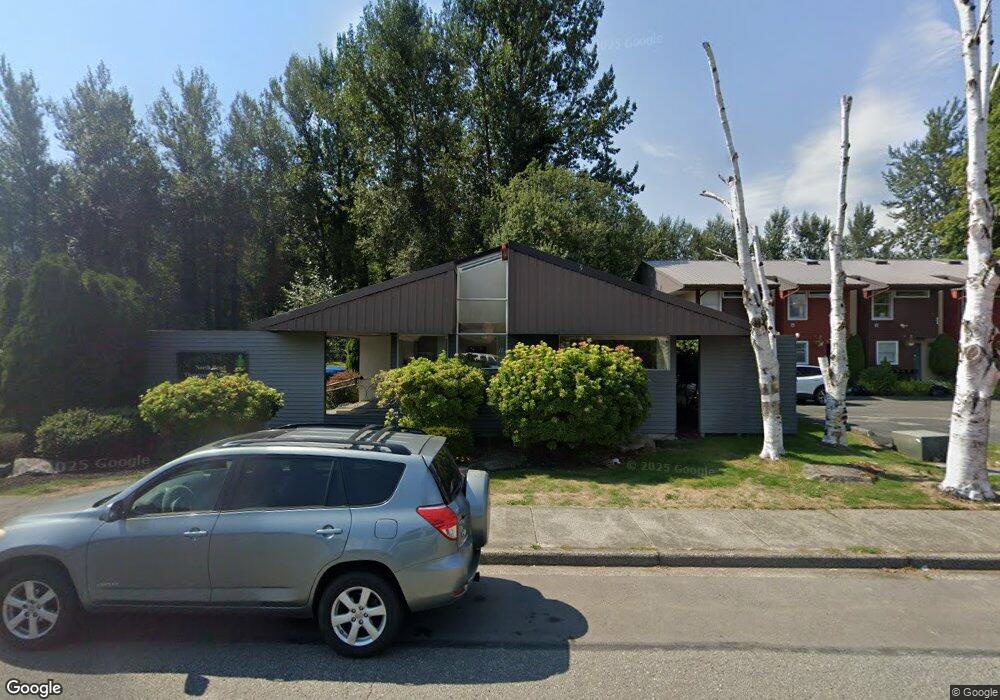
421 Main Ave S North Bend, WA 98045
Estimated Value: $642,000 - $906,000
2
Beds
2
Baths
1,470
Sq Ft
$535/Sq Ft
Est. Value
About This Home
This home is located at 421 Main Ave S, North Bend, WA 98045 and is currently estimated at $786,385, approximately $534 per square foot. 421 Main Ave S is a home located in King County with nearby schools including North Bend Elementary School, Twin Falls Middle School, and Mount Si High School.
Ownership History
Date
Name
Owned For
Owner Type
Purchase Details
Closed on
Jun 20, 2011
Sold by
Gliva Ellen
Bought by
Black Gavin J and Black Katie L
Current Estimated Value
Home Financials for this Owner
Home Financials are based on the most recent Mortgage that was taken out on this home.
Original Mortgage
$200,000
Outstanding Balance
$137,357
Interest Rate
4.55%
Mortgage Type
Purchase Money Mortgage
Estimated Equity
$649,028
Purchase Details
Closed on
Nov 15, 1984
Sold by
Petree Harold J
Bought by
Gliva Charles
Create a Home Valuation Report for This Property
The Home Valuation Report is an in-depth analysis detailing your home's value as well as a comparison with similar homes in the area
Home Values in the Area
Average Home Value in this Area
Purchase History
| Date | Buyer | Sale Price | Title Company |
|---|---|---|---|
| Black Gavin J | $255,000 | Northpoint Escrow Title | |
| Gliva Charles | $48,000 | -- |
Source: Public Records
Mortgage History
| Date | Status | Borrower | Loan Amount |
|---|---|---|---|
| Open | Black Gavin J | $200,000 |
Source: Public Records
Tax History Compared to Growth
Tax History
| Year | Tax Paid | Tax Assessment Tax Assessment Total Assessment is a certain percentage of the fair market value that is determined by local assessors to be the total taxable value of land and additions on the property. | Land | Improvement |
|---|---|---|---|---|
| 2024 | $5,965 | $643,000 | $272,000 | $371,000 |
| 2023 | $5,468 | $572,000 | $247,000 | $325,000 |
| 2022 | $5,341 | $635,000 | $283,000 | $352,000 |
| 2021 | $4,958 | $493,000 | $215,000 | $278,000 |
| 2020 | $5,061 | $415,000 | $181,000 | $234,000 |
| 2018 | $4,559 | $381,000 | $158,000 | $223,000 |
| 2017 | $3,739 | $369,000 | $152,000 | $217,000 |
| 2016 | $3,525 | $312,000 | $134,000 | $178,000 |
| 2015 | $3,179 | $281,000 | $119,000 | $162,000 |
| 2014 | -- | $274,000 | $117,000 | $157,000 |
| 2013 | -- | $183,000 | $90,000 | $93,000 |
Source: Public Records
Map
Nearby Homes
- 41243 SE 123rd St
- 369 E Park St Unit D3
- 580 SE 8th St
- 1065 SW 12th St
- 690 SE 11th Place Unit 8
- 508 SE 11th Place
- 508 SE 11th Place Unit 14
- 639 SE 11th Place
- 639 SE 11th Place Unit 55
- 1335 Forster Blvd SW
- 716 SE 11th Place Unit 7
- 716 SE 11th Place
- 751 SE 11th St
- 1117 Swiftwater Way SE Unit 42
- Savannah Plan at Harrison Court
- Legacy Plan at Harrison Court
- Stafford Plan at Harrison Court
- Bridgewater Plan at Harrison Court
- Martin Plan at Harrison Court
- Caslon Plan at Harrison Court
- 419 Main Ave S
- 434 Main Ave S
- 427 Main Ave S Unit 38
- 427 Main Ave N Unit 40
- 427 Main Ave S Unit 42738
- 427 Main Ave S Unit 42737
- 427 Main Ave S Unit 42739
- 427 Main Ave S Unit 43536
- 427 Main Ave S Unit 43535
- 427 Main Ave S Unit 43534
- 427 Main Ave S Unit 43533
- 427 Main Ave S Unit 40
- 427 Main Ave S Unit 37
- 435 Main Ave S Unit 34
- 435 Main Ave S Unit 35
- 435 Main Ave S Unit 33
- 435 Main Ave S Unit 36
- 440 Main Ave S
- 439 Main Ave S
- 398 Main Ave S Unit 52