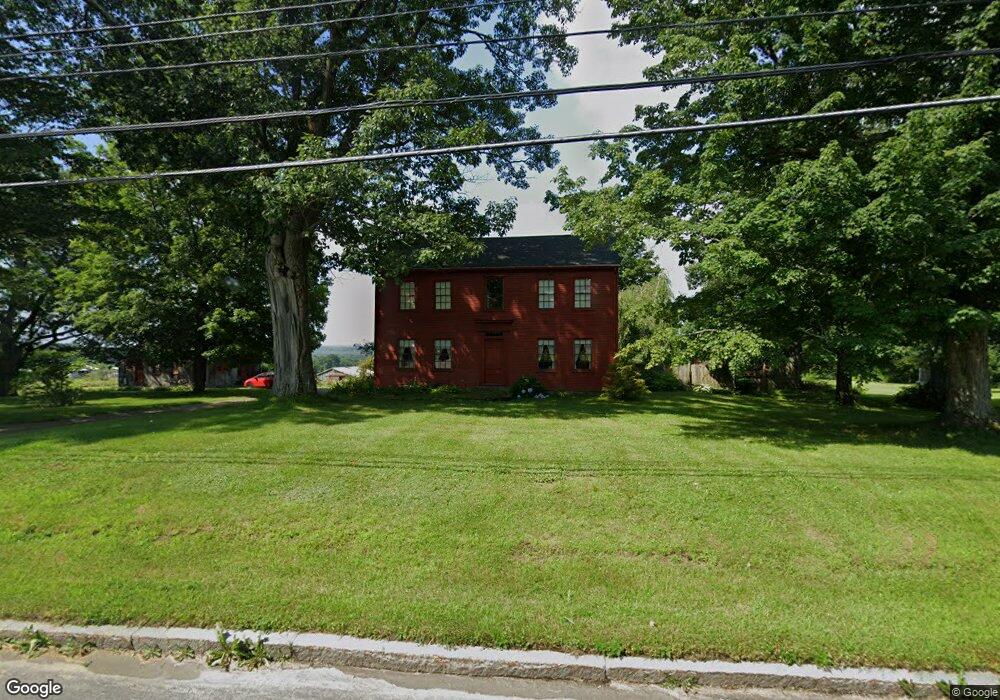
421 Main St Corinth, ME 04427
Estimated Value: $222,414 - $259,000
3
Beds
2
Baths
720
Sq Ft
$337/Sq Ft
Est. Value
About This Home
This home is located at 421 Main St, Corinth, ME 04427 and is currently estimated at $242,854, approximately $337 per square foot. 421 Main St is a home with nearby schools including Central Community Elementary School, Central High School, and Highview Christian Academy.
Ownership History
Date
Name
Owned For
Owner Type
Purchase Details
Closed on
Nov 20, 2020
Sold by
Laforge Elizabeth R
Bought by
Davenport Wendy S and Davenport Carlos E
Current Estimated Value
Home Financials for this Owner
Home Financials are based on the most recent Mortgage that was taken out on this home.
Original Mortgage
$155,200
Outstanding Balance
$138,106
Interest Rate
2.8%
Mortgage Type
New Conventional
Estimated Equity
$104,748
Create a Home Valuation Report for This Property
The Home Valuation Report is an in-depth analysis detailing your home's value as well as a comparison with similar homes in the area
Home Values in the Area
Average Home Value in this Area
Purchase History
| Date | Buyer | Sale Price | Title Company |
|---|---|---|---|
| Davenport Wendy S | -- | None Available |
Source: Public Records
Mortgage History
| Date | Status | Borrower | Loan Amount |
|---|---|---|---|
| Open | Davenport Wendy S | $155,200 |
Source: Public Records
Tax History
| Year | Tax Paid | Tax Assessment Tax Assessment Total Assessment is a certain percentage of the fair market value that is determined by local assessors to be the total taxable value of land and additions on the property. | Land | Improvement |
|---|---|---|---|---|
| 2024 | $2,175 | $161,100 | $33,700 | $127,400 |
| 2023 | $2,113 | $158,300 | $32,700 | $125,600 |
| 2022 | $1,729 | $101,700 | $19,400 | $82,300 |
| 2021 | $1,729 | $101,700 | $19,400 | $82,300 |
| 2020 | $1,627 | $101,700 | $19,400 | $82,300 |
| 2019 | $1,541 | $98,150 | $18,340 | $79,810 |
| 2018 | $1,561 | $98,150 | $18,340 | $79,810 |
| 2017 | $1,570 | $98,150 | $18,340 | $79,810 |
| 2016 | $1,541 | $98,150 | $18,340 | $79,810 |
| 2015 | $1,443 | $98,150 | $18,340 | $79,810 |
| 2014 | $1,433 | $98,150 | $18,340 | $79,810 |
| 2013 | $1,364 | $98,150 | $18,340 | $79,810 |
Source: Public Records
Map
Nearby Homes
Your Personal Tour Guide
Ask me questions while you tour the home.