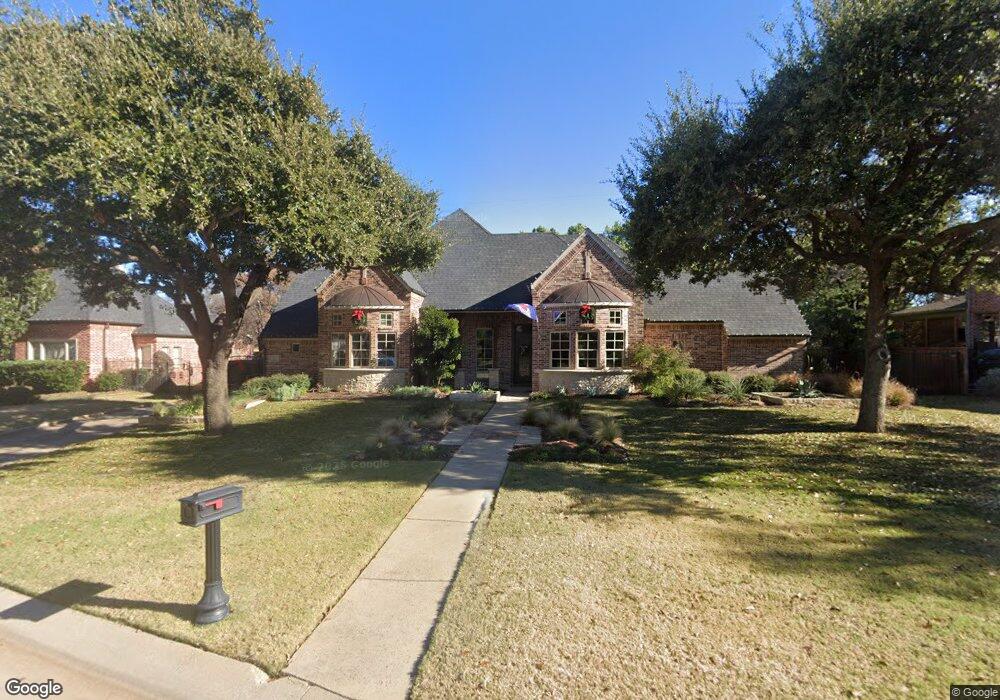
421 Marshall Rd Southlake, TX 76092
Estimated Value: $1,283,157 - $1,551,000
4
Beds
3
Baths
3,649
Sq Ft
$382/Sq Ft
Est. Value
About This Home
This home is located at 421 Marshall Rd, Southlake, TX 76092 and is currently estimated at $1,395,539, approximately $382 per square foot. 421 Marshall Rd is a home located in Tarrant County with nearby schools including Walnut Grove Elementary School, Don T. Durham Intermediate School, and Carroll Middle School.
Ownership History
Date
Name
Owned For
Owner Type
Purchase Details
Closed on
Jul 12, 2004
Sold by
Clare Gary and Clare Cathy
Bought by
Bonney Barton M and Bonney Andrea P
Current Estimated Value
Home Financials for this Owner
Home Financials are based on the most recent Mortgage that was taken out on this home.
Original Mortgage
$380,000
Outstanding Balance
$182,340
Interest Rate
5.62%
Mortgage Type
Purchase Money Mortgage
Estimated Equity
$1,213,199
Purchase Details
Closed on
Aug 30, 2000
Sold by
Mitcham Homes Llc
Bought by
Clare Gary and Clare Cathy
Home Financials for this Owner
Home Financials are based on the most recent Mortgage that was taken out on this home.
Original Mortgage
$320,000
Interest Rate
8.16%
Purchase Details
Closed on
Dec 28, 1999
Sold by
300 Convent Street Corp
Bought by
Mitcham Homes Llc
Home Financials for this Owner
Home Financials are based on the most recent Mortgage that was taken out on this home.
Original Mortgage
$341,600
Interest Rate
7.69%
Create a Home Valuation Report for This Property
The Home Valuation Report is an in-depth analysis detailing your home's value as well as a comparison with similar homes in the area
Home Values in the Area
Average Home Value in this Area
Purchase History
| Date | Buyer | Sale Price | Title Company |
|---|---|---|---|
| Bonney Barton M | -- | Blue Star Title Inc | |
| Clare Gary | -- | American Title Co | |
| Mitcham Homes Llc | -- | -- |
Source: Public Records
Mortgage History
| Date | Status | Borrower | Loan Amount |
|---|---|---|---|
| Open | Bonney Barton M | $380,000 | |
| Previous Owner | Clare Gary | $320,000 | |
| Previous Owner | Mitcham Homes Llc | $341,600 | |
| Closed | Clare Gary | $40,000 | |
| Closed | Bonney Barton M | $47,500 |
Source: Public Records
Tax History Compared to Growth
Tax History
| Year | Tax Paid | Tax Assessment Tax Assessment Total Assessment is a certain percentage of the fair market value that is determined by local assessors to be the total taxable value of land and additions on the property. | Land | Improvement |
|---|---|---|---|---|
| 2025 | $14,483 | $1,060,679 | $352,875 | $707,804 |
| 2024 | $14,483 | $1,060,679 | $352,875 | $707,804 |
| 2023 | $15,867 | $1,064,139 | $352,875 | $711,264 |
| 2022 | $17,073 | $940,748 | $235,250 | $705,498 |
| 2021 | $16,403 | $734,030 | $235,250 | $498,780 |
| 2020 | $15,034 | $672,542 | $211,725 | $460,817 |
| 2019 | $14,398 | $594,580 | $175,000 | $419,580 |
| 2018 | $14,830 | $650,714 | $175,000 | $475,714 |
| 2017 | $16,318 | $681,299 | $175,000 | $506,299 |
| 2016 | $14,835 | $624,981 | $175,000 | $449,981 |
| 2015 | $13,160 | $544,100 | $95,000 | $449,100 |
| 2014 | $13,160 | $544,100 | $95,000 | $449,100 |
Source: Public Records
Map
Nearby Homes
- 415 Marshall Rd
- 136 Sweet St
- 2803 Tyler St
- 517 Round Hollow Ln
- 5 W Dove Rd
- 200 Murphy Dr
- 112 Murphy Dr
- 3240 Woodland Dr
- 3179 Southlake Park Rd
- 2112 Beaver Creek Ln
- 1018 Quail Run Rd
- 2201 Shady Oaks Dr
- 2009 Wheeler Dr
- 3333 Southlake Park Rd
- 212 Saint Tropez Dr
- 904 Charleston Dr
- 1006 Quail Run Rd
- 424 Saint Tropez Dr
- 100 La Rambla Ct
- 116 La Rambla Ct