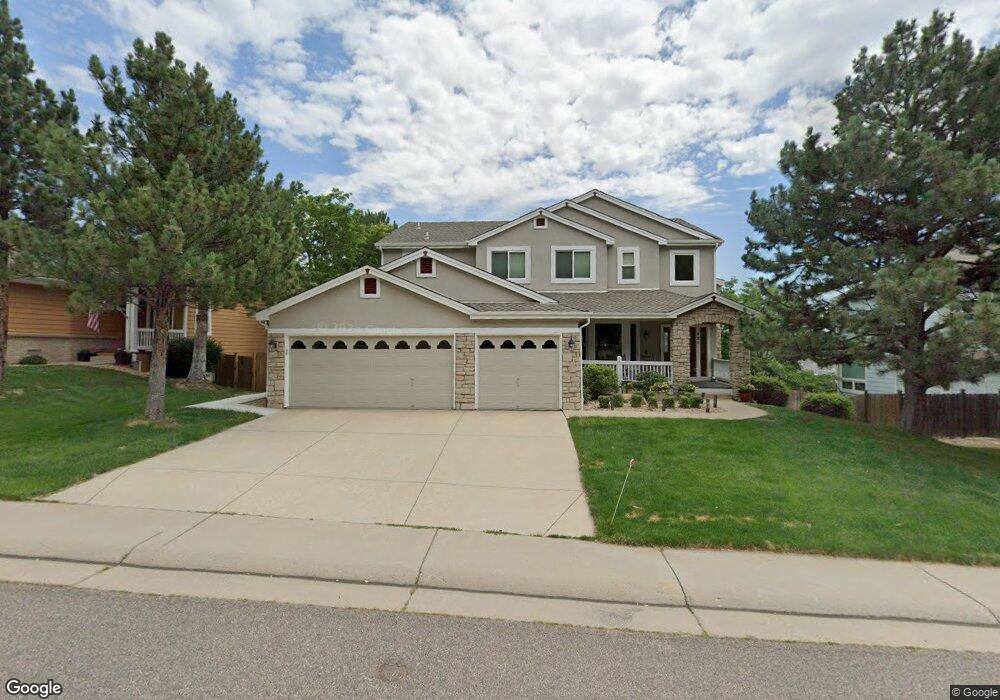
421 Mesa View Way Golden, CO 80403
Estimated Value: $1,500,097 - $1,884,000
5
Beds
5
Baths
4,270
Sq Ft
$385/Sq Ft
Est. Value
About This Home
This home is located at 421 Mesa View Way, Golden, CO 80403 and is currently estimated at $1,645,774, approximately $385 per square foot. 421 Mesa View Way is a home located in Jefferson County with nearby schools including Mitchell Elementary School, Bell Middle School, and Golden High School.
Ownership History
Date
Name
Owned For
Owner Type
Purchase Details
Closed on
Jul 22, 2020
Sold by
Brown Scott and Williams Kim
Bought by
Brown Scott and Williams Kim R
Current Estimated Value
Purchase Details
Closed on
Jul 18, 2008
Sold by
Nitz Gary A and Nitz Sara J
Bought by
Brown Scott and Williams Kim
Home Financials for this Owner
Home Financials are based on the most recent Mortgage that was taken out on this home.
Original Mortgage
$416,500
Interest Rate
6.09%
Mortgage Type
Purchase Money Mortgage
Purchase Details
Closed on
Jan 19, 1999
Sold by
Johnson Communities Inc
Bought by
Nitz Gary A and Nitz Sara J
Home Financials for this Owner
Home Financials are based on the most recent Mortgage that was taken out on this home.
Original Mortgage
$289,500
Interest Rate
6.89%
Create a Home Valuation Report for This Property
The Home Valuation Report is an in-depth analysis detailing your home's value as well as a comparison with similar homes in the area
Home Values in the Area
Average Home Value in this Area
Purchase History
| Date | Buyer | Sale Price | Title Company |
|---|---|---|---|
| Brown Scott | -- | None Available | |
| Brown Scott | $605,000 | Empire Title North Llc | |
| Nitz Gary A | $387,341 | Land Title | |
| Johnson Communities Inc | -- | Land Title |
Source: Public Records
Mortgage History
| Date | Status | Borrower | Loan Amount |
|---|---|---|---|
| Closed | Brown Scott | $416,500 | |
| Previous Owner | Nitz Gary A | $289,500 | |
| Closed | Nitz Gary A | $77,200 |
Source: Public Records
Tax History Compared to Growth
Tax History
| Year | Tax Paid | Tax Assessment Tax Assessment Total Assessment is a certain percentage of the fair market value that is determined by local assessors to be the total taxable value of land and additions on the property. | Land | Improvement |
|---|---|---|---|---|
| 2024 | $6,471 | $77,936 | $21,268 | $56,668 |
| 2023 | $6,471 | $77,936 | $21,268 | $56,668 |
| 2022 | $4,602 | $60,181 | $18,466 | $41,715 |
| 2021 | $4,676 | $61,914 | $18,998 | $42,916 |
| 2020 | $3,983 | $54,034 | $14,071 | $39,963 |
| 2019 | $3,926 | $54,034 | $14,071 | $39,963 |
| 2018 | $4,473 | $51,819 | $11,069 | $40,750 |
| 2017 | $4,052 | $51,819 | $11,069 | $40,750 |
| 2016 | $4,420 | $52,870 | $11,072 | $41,798 |
| 2015 | $3,795 | $52,870 | $11,072 | $41,798 |
| 2014 | $3,795 | $42,620 | $10,804 | $31,816 |
Source: Public Records
Map
Nearby Homes
- 474 Snowberry Ct
- 165 Washington St
- 401 N Columbine St
- 613 Iowa St
- 101 Washington Ave
- 705 1st St
- 209 Washington Ave
- 410 Cheyenne St
- 213 Ford St
- 407 Washington Ave Unit B
- 401 Ridge Rd
- 911 6th St
- 707 Elm Cir
- 1014 8th St
- 565 East St
- 722 Washington Ave Unit 306
- 807 9th St
- 317 Sunshine Pkwy
- 300 Lily Ln
- 220 Lily Ln
- 433 Mesa View Way
- 409 Mesa View Way
- 397 Mesa View Way
- 445 Mesa View Way
- 412 Mesa View Way
- 444 Mesa View Way
- 390 Mesa View Way
- 385 Mesa View Way
- 456 Mesa View Way
- 457 Mesa View Way
- 388 Mesa View Way
- 446 White Ash Dr
- 458 White Ash Dr
- 468 Mesa View Way
- 460 White Ash Dr
- 472 White Ash Dr
- 434 White Ash Dr
- 373 Mesa View Way
- 376 Mesa View Way
- 479 Mesa View Way