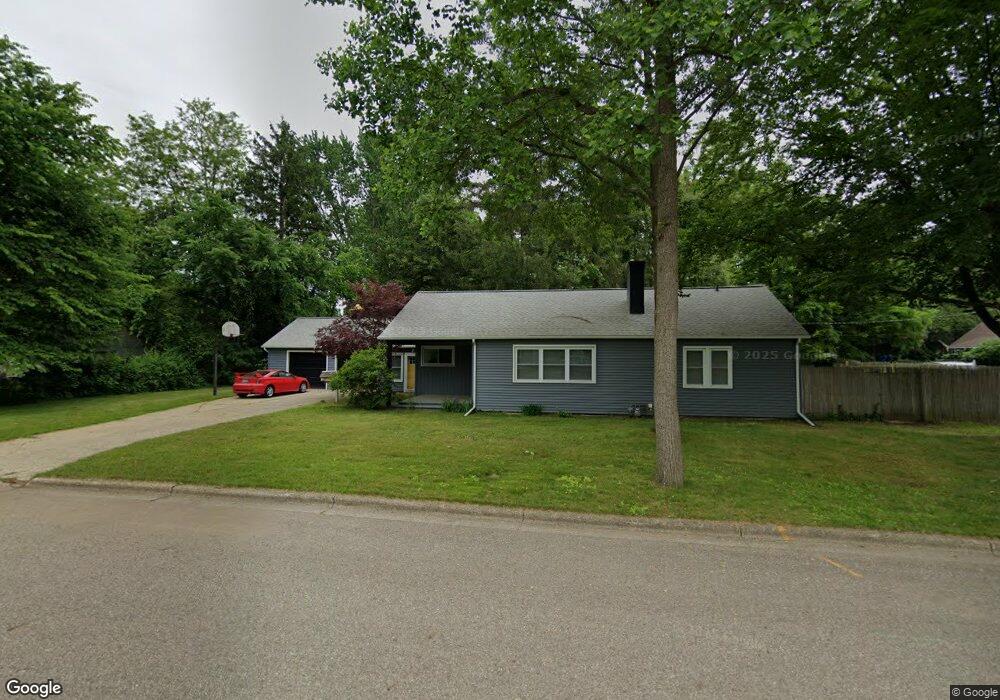
421 Morrell St Plainwell, MI 49080
Estimated Value: $233,000 - $286,000
3
Beds
2
Baths
2,365
Sq Ft
$107/Sq Ft
Est. Value
About This Home
This home is located at 421 Morrell St, Plainwell, MI 49080 and is currently estimated at $253,765, approximately $107 per square foot. 421 Morrell St is a home located in Allegan County with nearby schools including Plainwell High School and Otsego Christian Academy.
Ownership History
Date
Name
Owned For
Owner Type
Purchase Details
Closed on
Feb 16, 2005
Sold by
Haase Judith A and Deback Judith A
Bought by
Heed Nancy
Current Estimated Value
Home Financials for this Owner
Home Financials are based on the most recent Mortgage that was taken out on this home.
Original Mortgage
$21,750
Interest Rate
5.71%
Mortgage Type
Future Advance Clause Open End Mortgage
Create a Home Valuation Report for This Property
The Home Valuation Report is an in-depth analysis detailing your home's value as well as a comparison with similar homes in the area
Home Values in the Area
Average Home Value in this Area
Purchase History
| Date | Buyer | Sale Price | Title Company |
|---|---|---|---|
| Heed Nancy | $145,000 | Chicago Title |
Source: Public Records
Mortgage History
| Date | Status | Borrower | Loan Amount |
|---|---|---|---|
| Closed | Heed Nancy | $21,750 | |
| Open | Heed Nancy | $116,000 |
Source: Public Records
Tax History
| Year | Tax Paid | Tax Assessment Tax Assessment Total Assessment is a certain percentage of the fair market value that is determined by local assessors to be the total taxable value of land and additions on the property. | Land | Improvement |
|---|---|---|---|---|
| 2025 | $3,242 | $130,000 | $46,700 | $83,300 |
| 2024 | $2,935 | $118,800 | $41,600 | $77,200 |
| 2023 | $2,975 | $101,600 | $37,000 | $64,600 |
| 2022 | $2,935 | $89,200 | $31,200 | $58,000 |
| 2021 | $2,819 | $81,900 | $28,100 | $53,800 |
| 2020 | $2,783 | $75,300 | $24,300 | $51,000 |
| 2019 | $2,525 | $67,600 | $21,600 | $46,000 |
| 2018 | $0 | $69,800 | $24,200 | $45,600 |
| 2017 | $0 | $68,200 | $21,800 | $46,400 |
| 2016 | $0 | $62,800 | $18,600 | $44,200 |
| 2015 | -- | $62,800 | $18,600 | $44,200 |
| 2014 | -- | $54,200 | $18,200 | $36,000 |
| 2013 | -- | $53,100 | $18,200 | $34,900 |
Source: Public Records
Map
Nearby Homes
- 551 W Bridge St
- V/L Bronson Ave
- 936 James St
- 1046 Bronson Ave
- 140 W 1st Ave
- 320 S Sunset St
- 721 E Bridge St
- 355 12th St
- 1224 102nd Ave
- 1248 Keith St
- 10809 N 12th St
- 830 Miller Rd Unit 26.98 Acres
- 323 13th St
- V/L N 12th St
- 4613 W Ab Ave
- 1006 Goodsell St
- 1038 Allen Ct
- 909 Barton St
- 1009 Barton St
- 575 Rushing Dr
Your Personal Tour Guide
Ask me questions while you tour the home.