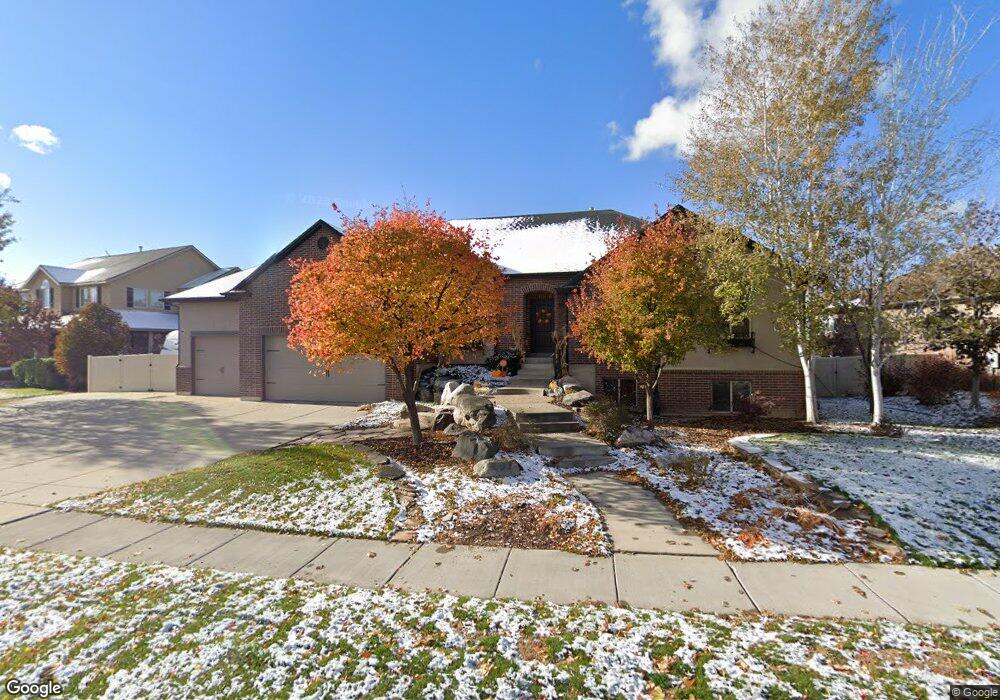
421 N 2975 W Layton, UT 84041
Estimated Value: $707,000 - $910,000
3
Beds
2
Baths
3,754
Sq Ft
$204/Sq Ft
Est. Value
About This Home
This home is located at 421 N 2975 W, Layton, UT 84041 and is currently estimated at $765,511, approximately $203 per square foot. 421 N 2975 W is a home located in Davis County with nearby schools including Sand Springs Elementary School, Legacy Junior High School, and Layton High School.
Ownership History
Date
Name
Owned For
Owner Type
Purchase Details
Closed on
Aug 23, 2019
Sold by
Denny Aaron D and Denny Amee N
Bought by
Watson Matthew and Watson Amy L
Current Estimated Value
Home Financials for this Owner
Home Financials are based on the most recent Mortgage that was taken out on this home.
Original Mortgage
$350,000
Outstanding Balance
$306,535
Interest Rate
3.7%
Mortgage Type
New Conventional
Estimated Equity
$458,976
Purchase Details
Closed on
Sep 1, 2010
Sold by
Aber Garry L and Aber Christy L
Bought by
Denny Aaron D and Denny Amee N
Home Financials for this Owner
Home Financials are based on the most recent Mortgage that was taken out on this home.
Original Mortgage
$190,000
Interest Rate
4.51%
Mortgage Type
New Conventional
Purchase Details
Closed on
Oct 29, 2004
Sold by
Mountain Green Development Llc
Bought by
Big Boy Investments Inc
Purchase Details
Closed on
Oct 26, 2004
Sold by
Big Boy Investments Inc
Bought by
Aber Garry L and Aber Christy L
Create a Home Valuation Report for This Property
The Home Valuation Report is an in-depth analysis detailing your home's value as well as a comparison with similar homes in the area
Home Values in the Area
Average Home Value in this Area
Purchase History
| Date | Buyer | Sale Price | Title Company |
|---|---|---|---|
| Watson Matthew | -- | Mountain View Title & | |
| Denny Aaron D | -- | Mountain View Title | |
| Big Boy Investments Inc | -- | Bonneville Title Company | |
| Aber Garry L | -- | Lincoln Title Ins Agency |
Source: Public Records
Mortgage History
| Date | Status | Borrower | Loan Amount |
|---|---|---|---|
| Open | Watson Matthew | $350,000 | |
| Previous Owner | Denny Aaron D | $190,000 |
Source: Public Records
Tax History Compared to Growth
Tax History
| Year | Tax Paid | Tax Assessment Tax Assessment Total Assessment is a certain percentage of the fair market value that is determined by local assessors to be the total taxable value of land and additions on the property. | Land | Improvement |
|---|---|---|---|---|
| 2025 | $3,574 | $375,101 | $148,913 | $226,188 |
| 2024 | $3,547 | $375,100 | $155,865 | $219,235 |
| 2023 | $3,444 | $642,000 | $172,477 | $469,523 |
| 2022 | $3,652 | $369,600 | $95,607 | $273,993 |
| 2021 | $3,385 | $511,000 | $143,353 | $367,647 |
| 2020 | $3,080 | $446,000 | $123,797 | $322,203 |
| 2019 | $2,996 | $425,000 | $119,171 | $305,829 |
| 2018 | $2,774 | $395,000 | $105,371 | $289,629 |
| 2016 | $2,576 | $189,200 | $45,478 | $143,722 |
| 2015 | $2,600 | $181,280 | $45,478 | $135,802 |
| 2014 | $2,211 | $157,657 | $45,478 | $112,179 |
| 2013 | -- | $173,465 | $43,391 | $130,074 |
Source: Public Records
Map
Nearby Homes