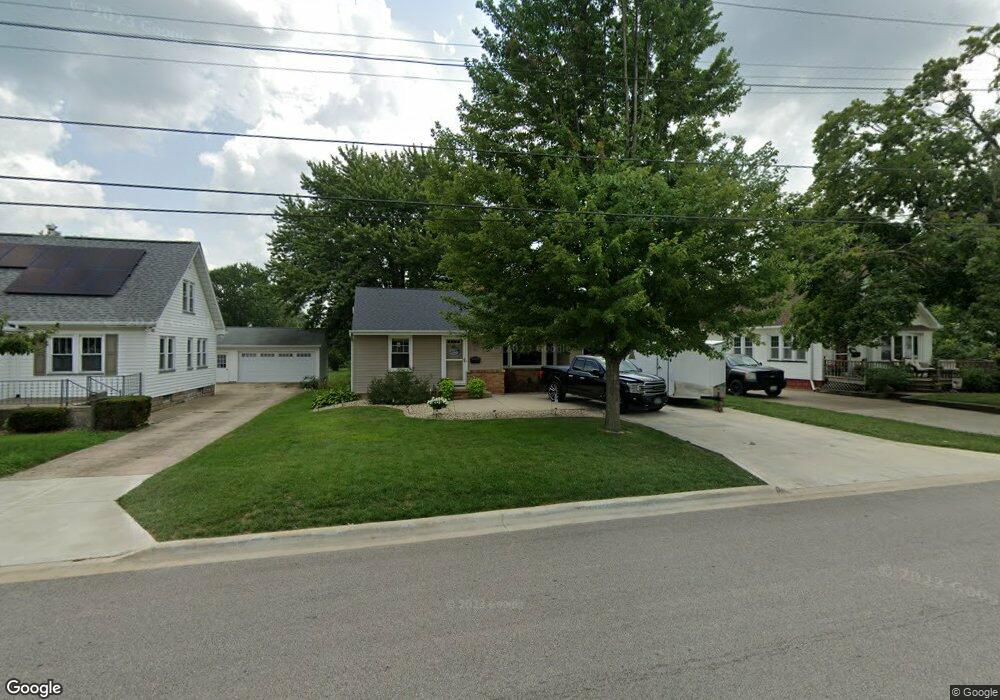
421 N Lawndale Ave Washington, IL 61571
Estimated Value: $182,000 - $197,767
4
Beds
2
Baths
1,604
Sq Ft
$119/Sq Ft
Est. Value
About This Home
This home is located at 421 N Lawndale Ave, Washington, IL 61571 and is currently estimated at $190,442, approximately $118 per square foot. 421 N Lawndale Ave is a home located in Tazewell County with nearby schools including Lincoln Grade School, Washington Middle School, and Washington Community High School.
Ownership History
Date
Name
Owned For
Owner Type
Purchase Details
Closed on
Nov 6, 2015
Sold by
Harter Thomas H and Kelly A Hartter Rev Liv Trust
Bought by
Behrens Courtney B
Current Estimated Value
Home Financials for this Owner
Home Financials are based on the most recent Mortgage that was taken out on this home.
Original Mortgage
$125,681
Outstanding Balance
$100,854
Interest Rate
4.4%
Mortgage Type
FHA
Estimated Equity
$89,588
Purchase Details
Closed on
Aug 10, 2015
Sold by
Hartter Thomas H and Hartter Kelly A
Bought by
Hartter Thomas H and Hartter Kelly A
Purchase Details
Closed on
Apr 25, 2014
Sold by
Williams Thomas E
Bought by
Hartter Kelly
Home Financials for this Owner
Home Financials are based on the most recent Mortgage that was taken out on this home.
Original Mortgage
$125,000
Interest Rate
4.33%
Mortgage Type
New Conventional
Create a Home Valuation Report for This Property
The Home Valuation Report is an in-depth analysis detailing your home's value as well as a comparison with similar homes in the area
Home Values in the Area
Average Home Value in this Area
Purchase History
| Date | Buyer | Sale Price | Title Company |
|---|---|---|---|
| Behrens Courtney B | $128,000 | -- | |
| Hartter Thomas H | -- | -- | |
| Hartter Kelly | $125,000 | -- |
Source: Public Records
Mortgage History
| Date | Status | Borrower | Loan Amount |
|---|---|---|---|
| Open | Behrens Courtney B | $125,681 | |
| Previous Owner | Hartter Kelly | $125,000 |
Source: Public Records
Tax History Compared to Growth
Tax History
| Year | Tax Paid | Tax Assessment Tax Assessment Total Assessment is a certain percentage of the fair market value that is determined by local assessors to be the total taxable value of land and additions on the property. | Land | Improvement |
|---|---|---|---|---|
| 2024 | $3,971 | $50,230 | $9,320 | $40,910 |
| 2023 | $3,971 | $46,600 | $8,650 | $37,950 |
| 2022 | $3,789 | $43,540 | $8,080 | $35,460 |
| 2021 | $3,657 | $42,470 | $7,880 | $34,590 |
| 2020 | $3,612 | $42,470 | $7,880 | $34,590 |
| 2019 | $3,553 | $42,470 | $7,880 | $34,590 |
| 2018 | $2,999 | $42,470 | $7,880 | $34,590 |
| 2017 | $2,922 | $42,470 | $7,880 | $34,590 |
| 2016 | $2,851 | $42,470 | $7,880 | $34,590 |
| 2015 | $2,470 | $0 | $0 | $0 |
| 2013 | $2,331 | $30,270 | $6,000 | $24,270 |
Source: Public Records
Map
Nearby Homes
- 1006 Knollcrest Dr
- 1003 Walnut St
- 909 Eldridge St
- 905 Eldridge St
- 121 S Elm St
- 201 S Elm St
- 205 S High St
- 840 N Main St Unit 1B
- 501 N Wood St
- 1139 E Guth Rd
- 320 Oakwood Cir
- 706 Yorkshire Ct
- 728 Wellington Dr
- 724 Wellington Dr
- 720 Wellington Dr
- 712 Wellington Dr
- 708 Wellington Dr
- 719 Wellington Dr
- 704 Wellington Dr
- 711 Wellington Dr
- 419 N Lawndale Ave
- 423 N Lawndale Ave
- 425 N Lawndale Ave
- 1003 Lawndale Ln
- 414 N Lawndale Ave
- 411 N Lawndale Ave
- 416 N Lawndale Ave
- 501 N Lawndale Ave
- 1002 Lawndale Ln
- 418 N Lawndale Ave
- 409 N Lawndale Ave
- 412 N Lawndale Ave
- 420 N Lawndale Ave
- 1005 Lawndale Ln
- 1004 Knollcrest Dr
- 410 N Lawndale Ave
- 500 N Lawndale Ave
- 408 N Lawndale Ave
- 407 N Lawndale Ave
- 1004 Lawndale Ln